Figures & data
Figure 1a Color photograph of a normal macula. The normal retinal vasculature is visible against a relatively homogeneous background, with the central macula (fovea) demonstrating normal pigmentary differences compared to the surrounding tissues.
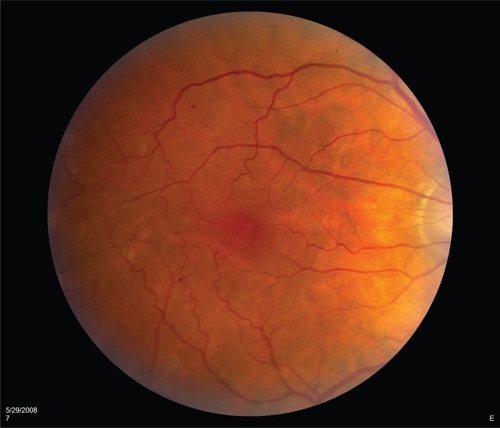
Figure 1b Optical coherence tomography image of a normal macula. The layers of the sensory retina appear homogeneous throughout, with a normal foveal depression.
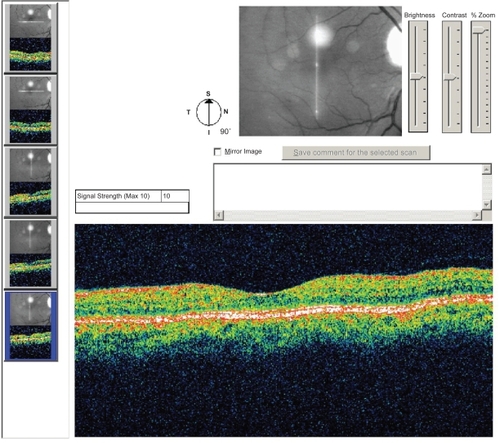
Figure 2a Color photograph of a macula exhibiting diabetic macular edema. Microaneurysms and intra-retinal hemorrhages are visible as red spots. Retinal thickening is visible as a loss of granularity combined with subtle changes in coloration and is best visualized in stereo using slit lamp biomicroscopy. Lipid exudates are visible as yellow streaks or spots, often distributed in a circinate pattern around leaking microaneurysms.
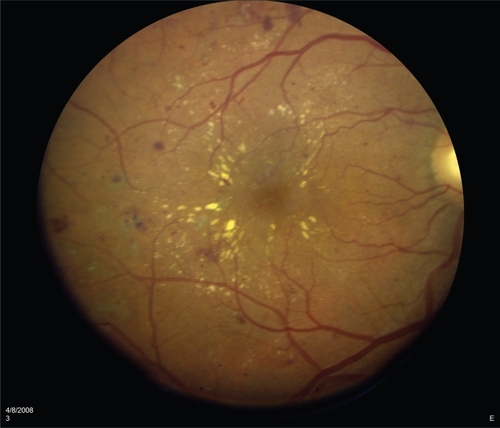
Figure 2b Optical coherence tomography image of a macula exhibiting diabetic macular edema. Thickening of the sensory retina is evident along with typical focal cystoid changes, seen as optically clear cavities within the retina. The foveal depression is lost due to edema.
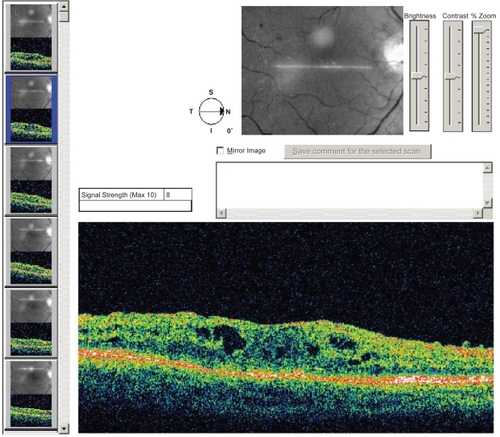
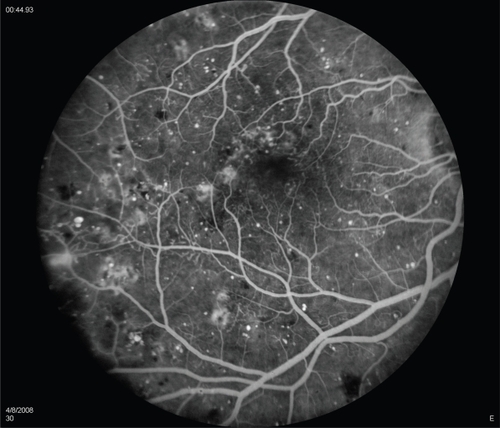
Figure 2c Fluorescein angiography of a macula exhibiting diabetic macular edema. The retinal vascular arcades are visible along with scattered areas of hyperfluorescence throughout the macula, indicating leakage of fluid due to diabetes-induced vascular incompetence.