Figures & data
Figure 1 The incidence of forearm, symptomatic vertebral and hip fractures in men and women from Cardiff (CitationJohansen et al 1997).
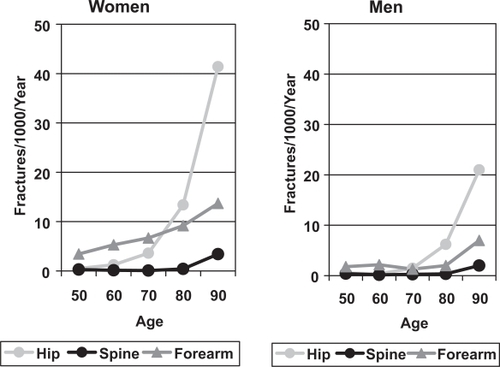
Figure 2 The incidence of morphometric vertebral fractures in men and women in the European Prospective Osteoporosis Study (CitationRoy et al 2003).
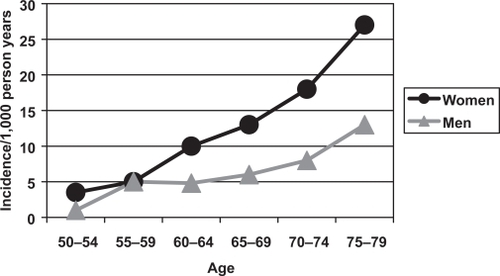
Figure 3 The Age-Standardised Mortality Ratio after fractures in men and women (CitationCenter et al 1999).
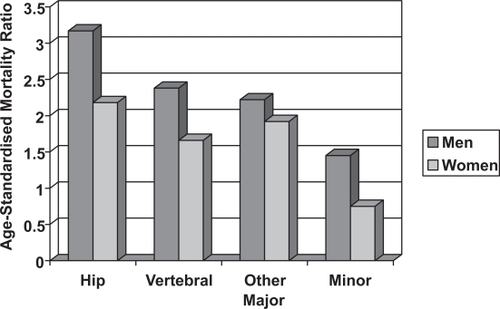
Figure 4 The relationship between femoral neck BMD and the incidence of hip fractures in 80 year old men and women in the Rotterdam Study (CitationDe Laet et al 1997).
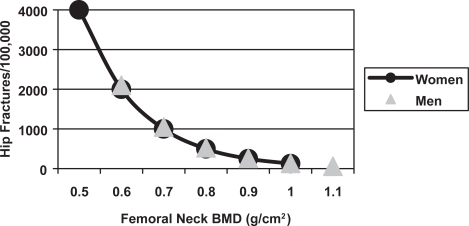
Figure 5 The mean reduction in lumbar spine and femoral neck BMD in men with distal forearm (CitationTuck and Raj 2002), symptomatic vertebral (CitationScane et al 1999) and hip (CitationPande et al 2000) fractures compared with age-matched male control subjects. The statistical significance is indicated (** = p < 0.01, *** = p < 0.001).
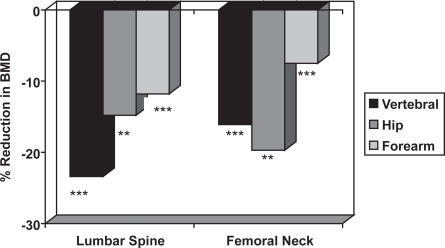
Table 1 Causes of secondary oeteoporosis in men
Table 2 Investigations for secondary osteoporosis in men
Table 3 Summary of the available evidence for treatments of male osteoporosis (A = randomised controlled trials, B = other well designed studies, C = expert opinion/reports)
Table 4 Relative potencies of bisphosphonates
Figure 6 The change in lumbar spine and femoral neck BMD in men with osteoporosis treated with alendronate or placebo (CitationKurland et al 2000). The statistical significance between the two groups is indicated (*** = p < 0.001).
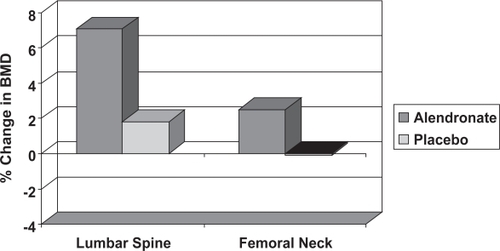
Figure 7 The change in lumbar spine and femoral neck BMD on treatment with subcutaneous Teriparatide 20 μg and 40 μg daily or placebo injections in men with osteoporosis. The statistical significance of differences from the placebo group is indicated (CitationKurland et al 2000: * = p < 0.05, *** = p < 0.001).
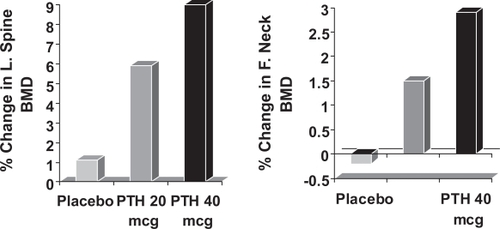
Figure 8 The change in lumbar spine BMD in men with osteoporosis treated with calcitonin or placebo (CitationDe Laet et al 1997). The statistical significance between the two groups is indicated.
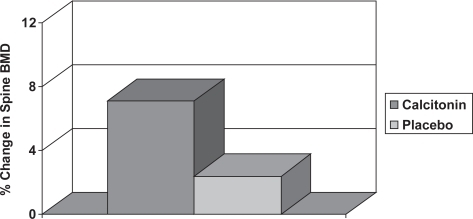
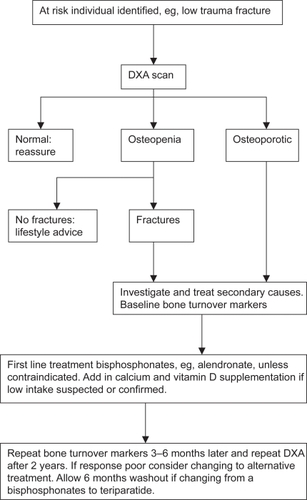
Figure 9 Proposed flow chart for the treatment of men with osteoporosis.