Figures & data
Figure 1 The relationship between age, trust (Trust 1 – cooperation, caring, and vulnerability; Trust 2 – quality and hospital reputation; Trust 3 – confidence; Trust 4 – distrust and fear) and patient satisfaction.
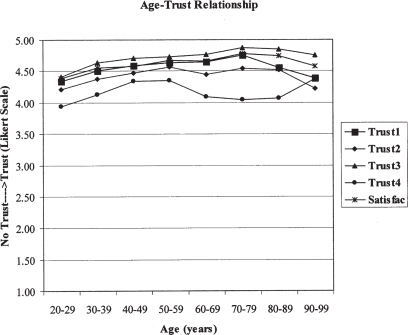
Table 1 Sample sociodemographics
Table 2 Comparison between trust and satisfaction among elderly (age ≥65 years) and younger (age <65 years) groups
Table 3 Characteristics of the female breast cancer patients (Study 1: n=170)
Table 4 A synthesis of theories and definitions of trust and distrust
Table 5 Patient–physician interpersonal relations as a function of low and high, trust and distrust
Table 6 Patient–physician trust–distrust scale statements
Table 7 Distribution of trust–distrust scale statement by theories of trust–distrust
Table 8 Distribution of scale statement in the trust–distrust quadrants
Table 9 Profile of patient–physician trust levels: costs versus benefits