Figures & data
Table 1 Aging and respiratory muscle strength
Figure 1 Effect of environmental exposure on airways.
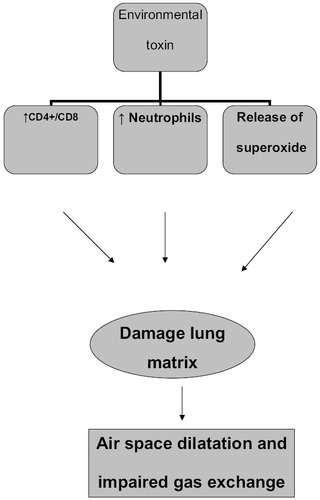
Figure 2 Relationship between lung volumes and lung capacities.
Abbreviations: ERV, expiratory reserve volume; FRC, functional residual capacity; IC, inspiratory capacity; IRV, inspiratory reserve volume; RV, residual volume; TLC, total lung capacity; TV, total volume; VC, vital capacity.
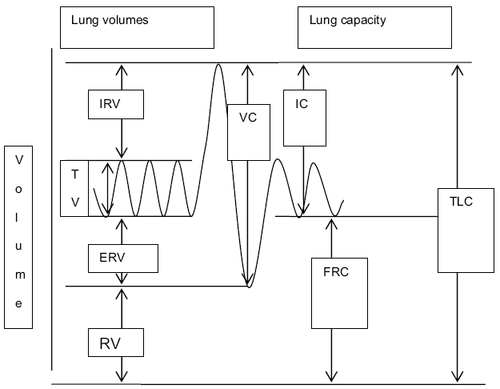
Table 2 Static lung volumes
Figure 3 Age-related decline in forced expiratory volume in one second (FEV1)% predicted plotted as % of maximal at age 20 years against age.
Note: Adapted from CitationWare JH, Dockery DW, Louis TA, et al. 1990. Longitudinal and cross-sectional estimates of pulmonary function decline in never-smoking adults. Am J Epidemiol, 132:685-700. Copyright © 2004. Reprinted with permission from Oxford University Press.
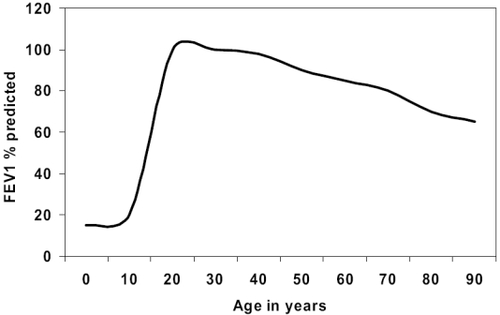
Table 3 Lung capacities are sum of two or more static lung volumes
Table 4 Lung function studies
Figure 4 Mechanism of action of beta agonist.
Abbreviations: ATP, adenosine triphosphate; cAMP, cyclic adenosine monophosphate.
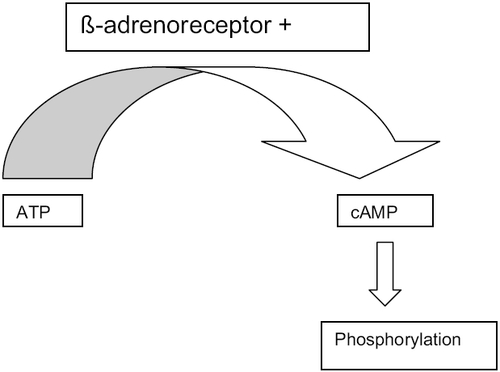
Table 5 Ventilatory response to hypoxia and hypercapnia
Table 6 Anatomical and physiological changes of respiratory system with aging