Figures & data
Table 1 Descriptive characteristic of the sample at baseline (N=2404)
Figure 1 Mean systolic and diastolic blood pressures by years of follow-up (N=2404).
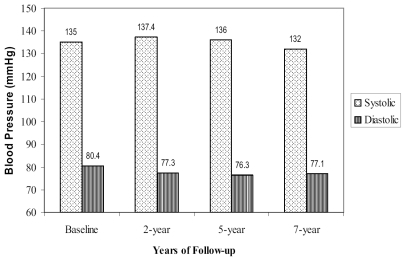
Figure 2 Average mean systolic and diastolic blood pressures over a 7-year period by age categories at baseline (N=2404).
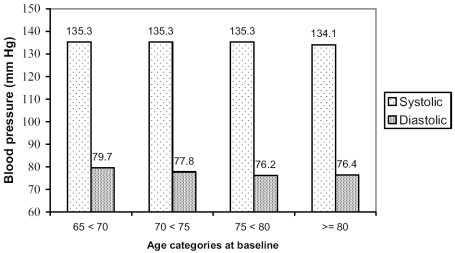
Figure 3 Average mean systolic and diastolic blood pressures over a 7-year period by body mass index (BMI) categories at baseline (N=2404).
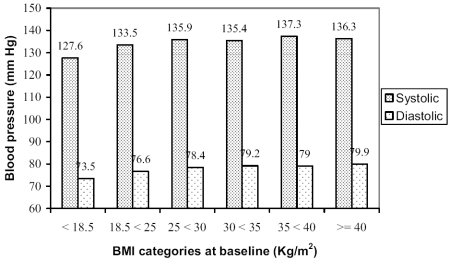
Table 2 General linear mixed models estimates for systolic blood pressure (mm Hg) as a function of BMI categories at baseline over 7-year period among older Mexican Americans (N=2404)
Table 3 General linear mixed models estimates for diastolic blood pressure (mm Hg) as a function of BMI categories at baseline over 7-year period among older Mexican Americans (N=2404)