Figures & data
Table 1 Pharmacological features of rivastigmine
Table 2 Instruments used to evalutate the efficacy of rivastigmine in treating Alzheimer’s disease
Table 3 Summary of rivastigmine clinical trials
Figure 1 Percentage of patients with moderate to moderately severe AD showing clinically relevant improvements on the ADAS-cog after 52 weeks.
Notes: *p < 0.05 versus original placebo group; **p = 0.116 versus original placebo group.
Abbreviations: AD, Alzheimer’s disease; ADAS-cog, Alzheimer’s Disease Assessment Scale–Cognitive section.
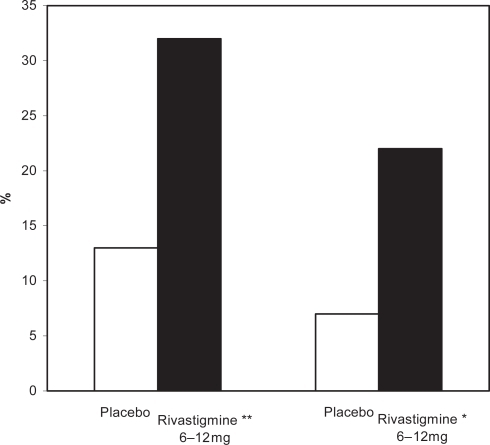
Figure 2 Percentages of patients in the high- and low-dose rivastigmine group and the placebo group on the PDS after 26 weeks.
Note: * p = 0.02 vs placebo
Abbreviations: PDS, Progressive Deterioration Scale.
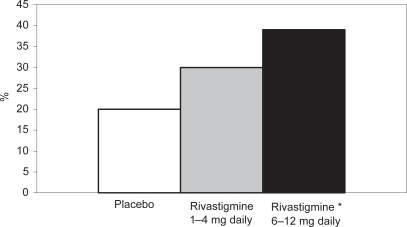
Figure 3 Percentages of patients in the high- and low-dose rivastigmine group and the placebo group on CIBIC-plus after 26 weeks.
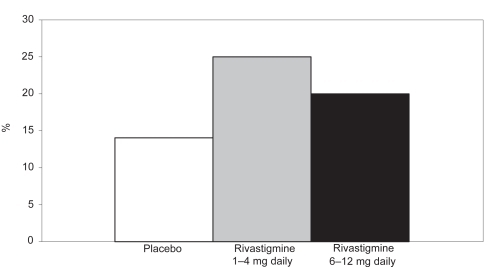
Figure 4 Common adverse events observed with rivastigmine therapy.
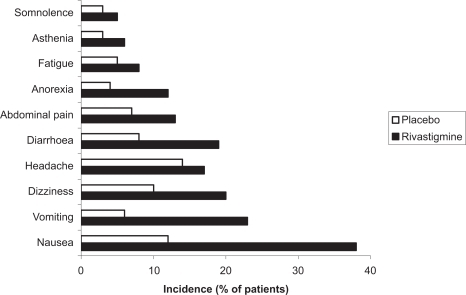
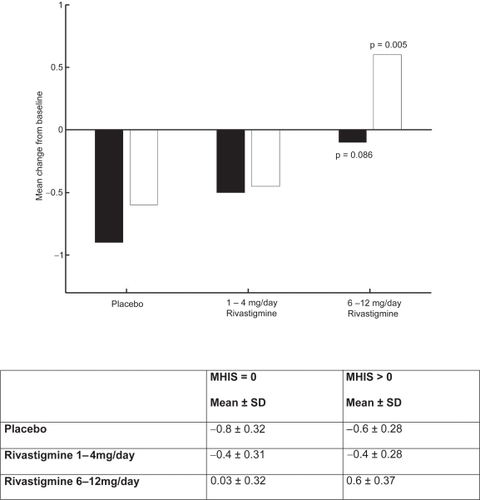
Figure 5 ADAS-cog mean change from baseline scores at week 26.
Note: ▪ MHIS = 0; □ MHIS = 1
Abbreviations: ADAS-cog, Alzheimer’s Disease Assessment Scale–Cognitive section; MHIS, Modified Hachinski Ischemic Score.
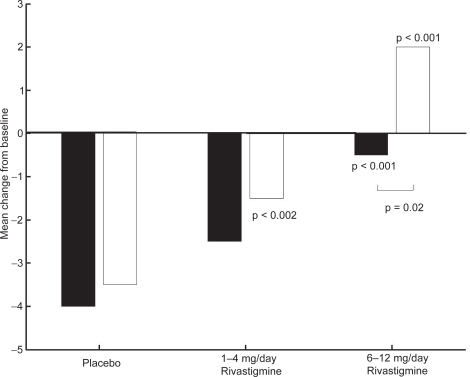
Figure 6 PDS mean change from baseline score at week 26.
Notes: ▪ MHIS = 0; □ MHIS>0.
Abbreviations: MHIS, Modified Hachinski Ischemic Score; PDS, Progressive Deterioration Scale; SD, standard deviation.
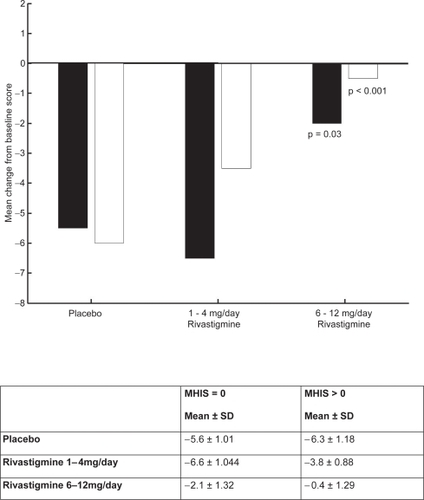
Figure 7 CIBIC-plus mean score for population.
Notes: ▪ MHIS = 0; □ MHIS > 0.
Abbreviations: CIBIC-plus, Clinician Interview-Based Impression of Change-plus; MHIS, Modified Hachinski Ischemic Score; SD, standard deviation.
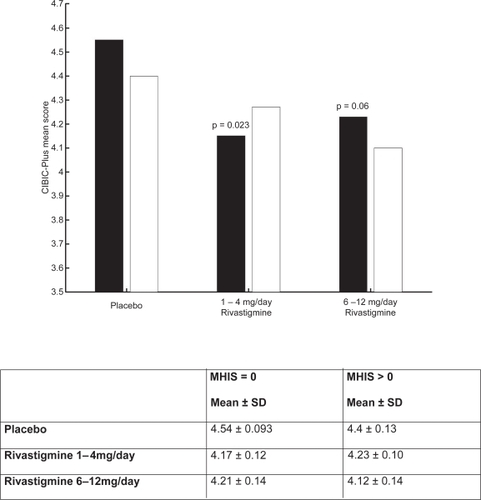
Figure 8 MMSE mean change from baseline score at week 26.
Abbreviations: MHIS, Modified Hachinski Ischemic Score; MMSE, Mini Mental State Examination; SD, standard deviation.