Figures & data
Figure 1 Generic chemical structure of a bisphosphonate and of ibandronate, risedronate, alendronate and zoledronate. In all cases R1 resembles a hydroxyl group while R2 is either an alkylamine (ibandronate and alendronate) or an acrylamine (risedronate and zoledronate). Copyright © 2004. Reproduced with permission from Springer Science and Business Media. Bauss F, Russell RG. 2004. Ibandronate in osteoporosis: preclinical data and rationale for intermittent dosing. Osteoporos Int, 15:423–33.
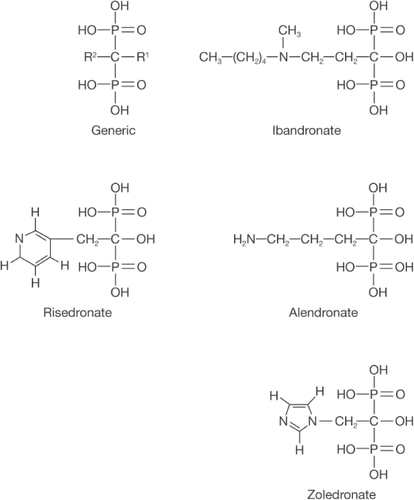
Figure 2 Changes (% ± SEM) in lumbar spine BMD (L2–L4) before and 3, 6, 9, and 12 months after iv injection of ibandronate or placebo. The arrows indicate the time of iv injection of study drug. Copyright © 1997. Reproduced with permission from Elsevier. Thiébaud D, Burckhardt P, Kriegbaum H, et al. 1997. Three monthly intravenous injections of ibandronate in the treatment of postmenopausal osteoporosis. Am J Med, 103:298–307.
Abbreviations: BMD, bone mineral density; iv, intravenous; SEM, standard error of mean.
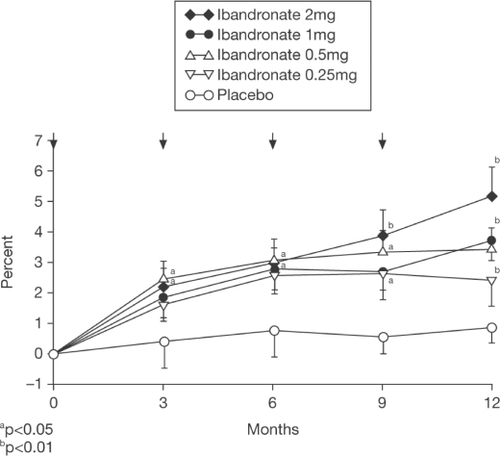
Figure 3 Changes (% ± SEM) in C-telopeptide in 2-hour fasting morning urine (upper panel) and serum osteocalcin (lower panel) before and 1, 2, 3, 6, 9, 10, 11, 12, and 15 months after iv injection of ibandronate or placebo. The arrows indicate the time of iv injection of study drug Copyright © 1997. Reproduced with permission from Elsevier. Thiébaud D, Burckhardt P, Kriegbaum H, et al. 1997. Three monthly intravenous injections of ibandronate in the treatment of postmenopausal osteoporosis. Am J Med, 103:298–307.
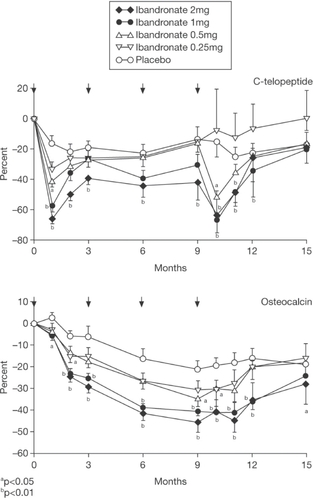
Figure 4 Median change versus placebo (%) in CTX/creatinine excretion with 1 mg, 0.5 mg ibandronate and placebo iv injections given once every 3 months. Copyright © 2004. Reproduced with permission from Elsevier. Recker RR, Stakkes-tad J, Chesnut C, et al. 2004. Insufficiently dosed intravenous ibandronate injections are associated with suboptimal antifracture efficacy in postmenopausal osteoporosis. Bone, 34:890–9.
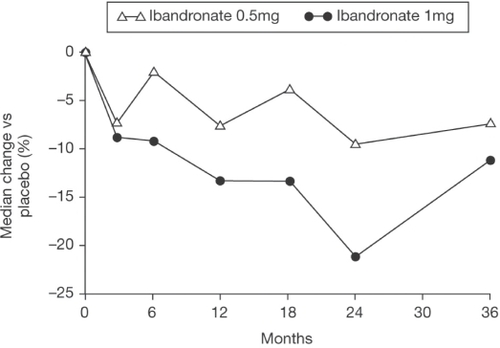
Figure 5 Mean (SD) change (%) from baseline in lumbar spine (L1–L4) BMD; ITT analysis. Copyright © 2004. Reprinted with permission from Elsevier. Adami S, Felsenberg D, Christiansen C, et al. 2004. Efficacy and safety of ibandronate given by intravenous injection once every 3 months. Bone, 34:881–9.
Abbreviations: BMD, bone mineral density; ITT, intention-to-treat; SD, standard deviation.
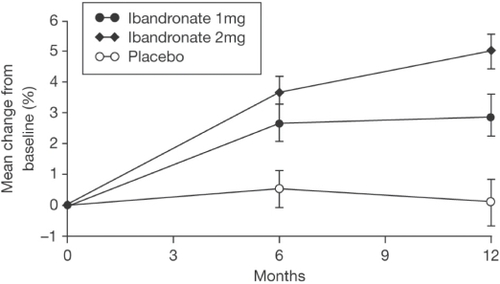
Figure 6 Median change (%) from baseline in serum CTX (A), urinary CTX/creati-nine (B), and serum osteocalcin (C); ITT analysis. Copyright © 2004. Reprinted with permission from Elsevier. Adami S, Felsenberg D, Christiansen C, et al. 2004. Efficacy and safety of ibandronate given by intravenous injection once every 3 months. Bone, 34:881–9.
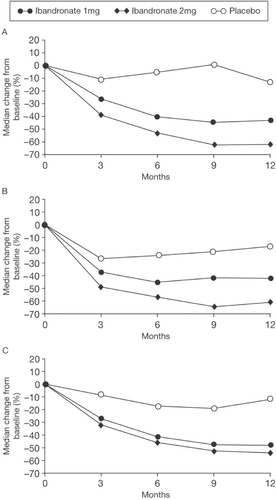
Table 1 Change (%) from baseline in sCTX levels in the PP population (CitationDelmas et al 2006)
Figure 7 Mean change from baseline in lumbar spine and proximal femur BMD after 1 year in the PP population. Bars show the 95% CI (CitationDelmas et al 2006).
Abbreviations: BMD, bone mineral density; CI, confidence interval; PP, per-protocol; q2mo, every 2 months; q3mo, every 3 months.
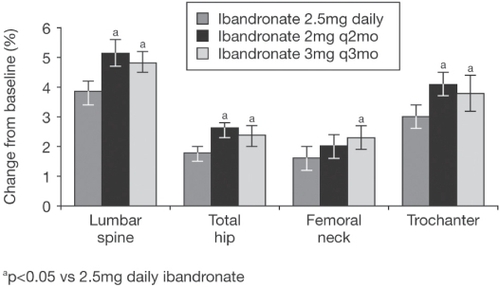
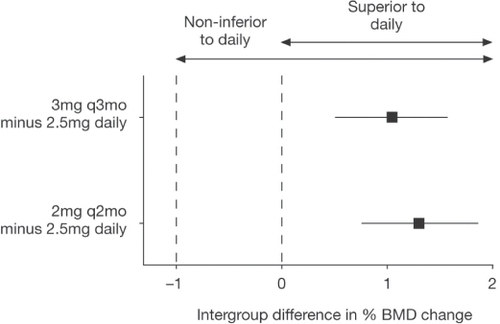
Figure 8 Noninferiority analysis of mean change (%) from baseline in lumbar spine (L2–L4) BMD after 1 year in the PP population. Squares and horizontal lines show the mean difference (and 95% CI) between each group receiving iv medication and the group receiving oral medication (expressed as iv minus oral) (CitationDelmas et al 2006).