Figures & data
Table 1 Baseline characteristics of patients with α1-AT deficiency and without deficiency
Table 2 Follow-up data after LVRS in the α1-AT deficient and nondeficient groups
Figure 1 Evolution of FEV1 before LVRS, at 3–6 months, and at 1 year after LVRS.
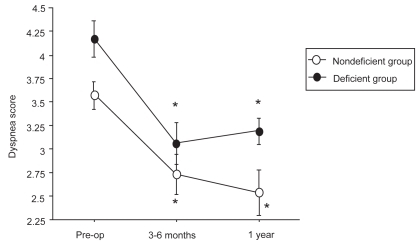
Figure 2 Evolution of dyspnea score before LVRS, at 3–6 months, and at 1 year after LVRS.
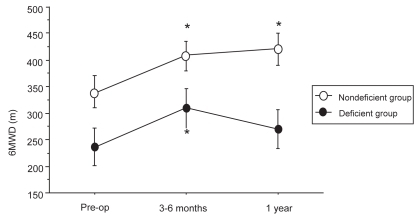
Figure 3 Evolution of 6MWD before LVRS, at 3–6 months, and at 1 year after LVRS.
*p < 0.05 compared with pre-operative values.
*p < 0.05 compared with pre-operative values.
*p < 0.05 compared with pre-operative values.
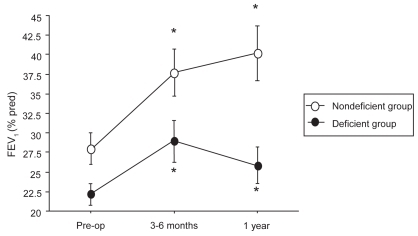
Figure 2 Evolution of dyspnea score before LVRS, at 3–6 months, and at 1 year after LVRS.
Figure 3 Evolution of 6MWD before LVRS, at 3–6 months, and at 1 year after LVRS.
*p < 0.05 compared with pre-operative values.
*p < 0.05 compared with pre-operative values.
Figure 3 Evolution of 6MWD before LVRS, at 3–6 months, and at 1 year after LVRS.
*p < 0.05 compared with pre-operative values.
Table 3 Number of patients with persistent increase in FEV1 and 6MWD according to α1-AT deficiency status (gain expressed in comparison with baseline)