Figures & data
Figure 1 Pressure volume relationship of the passive respiratory system. Lower and upper boundaries of the elastic recoil pressure–volume relationship of the respiratory system in healthy subjects (---), in patients with narrowed airways (—), and in patients with loss of lung elastic recoil (·····). The loops represent tidal breathing at rest (—) and during exercise (·····).
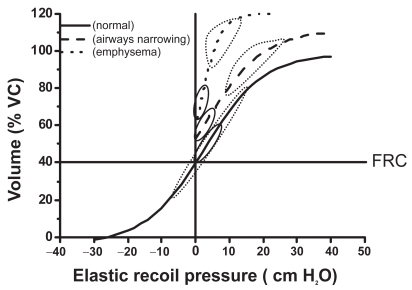
Figure 2 Effects of time and resistance on the change in expiratory volume. Rates of changes of volume after a similar given change of alveolar pressure in a subject with normal respiratory system resistance (—) and a resistance 3 times greater (---) such as in COPD, assuming a constant compliance. Note the marked effect of resistance on the volume change, particularly when the available time is shortened.
Abbreviations: COPD, chronic obstructive pulmonary disease.
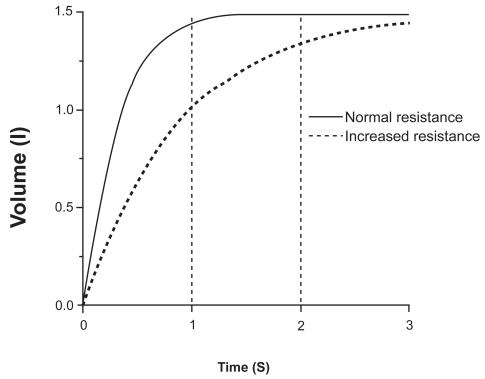
Figure 3 Iso-volume pressure-flow relationship. Schematic representation of the pressure-flow relationship in a healthy (normal) subject and a patient with COPD, showing the effect of the increased expiratory resistance upon the maximum expiratory flow and in both cases the independence of the maximum flow from the pleural pressure. Copyright © 1986. Modified with permission from CitationPride NB, Macklem PT. 1986. Lung mechanics in disease. In: Fishman AP (ed). Handbook of physiology, Section 3, Volume III, Part 2: The respiratory system. Bethesda MD: American Physiological Society, pp 659–92.
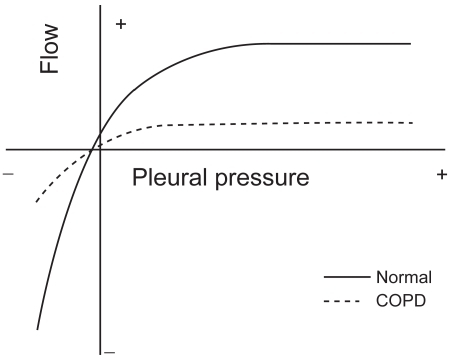
Figure 4 Maximum and tidal flow-volume curves in subjects with and without flow limitation. In this figure it can be seen an schematic representation of the spontaneous flow-volume curves generated at tidal volume at rest (inner dotted line ····) and peak exercise (dashed line ----) compared with the maximum flow volume curve in a subject without flow limitation able to reduce its end-expiratory lung volume (Panel A) and a flow-limited COPD patient with dynamic hyperinflation (Panel B).
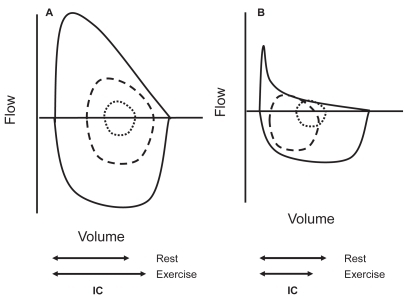
Table 1 Main clinical consequences of dynamic hyperinflation
Figure 5 Tidal volume encroachment by dynamic hyperinflation in COPD. In this figure the effects of respiratory rate and work rate on the end-inspiratory (EILV), end-expiratory lung volume (EELV), tidal volume (ie, EILV–EELV) and minute ventilation in subjects with severe COPD is displayed. While EILV increases with increasing respiratory rate from 20 to 30min−1 (lower left panel), so does EELV resulting in an almost constant (encroached) tidal volume. At respiratory rates higher than 30, though, EILV does not increase any more, however, EELV further increases resulting in a reduced tidal volume and even a drop in ventilation (left upper panel) at respiratory rates higher than 35min−1. In the right lower panel we can see how during progressive exercise tidal volume also decreases at high intensity due again to increase in EELV without parallel increase in EILV (Constructed with data from CitationPuente-Maestu et al 2005).
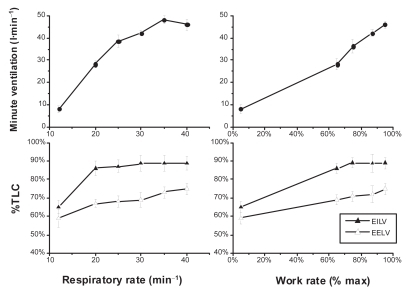
Table 2 Summary of trials on BD measuring resting or dynamic hyperinflations an outcome
Table 3 Subjects likely to benefit for lung volume surgery