Figures & data
Figure 1 Markov chain structure. Arrows represent the possible pathways of the disease course.
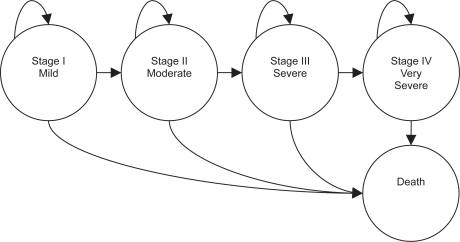
Table 1 Model initial population characteristics
Table 2 Main outcomes. Derived from CitationCalverley et al (2003) and CitationSzafransky et al (2003)
Table 3 Direct and indirect costs. Derived from CitationLucioni et al (2005) and CitationDal Negro et al (2003b)
Table 4 Model outcomes and costs (€) at the end of a life-long simulation (average values per patient)
Figure 2 Cost and outcomes resulting from 1, 5, and 10 years, and life-long time horizon simulation.
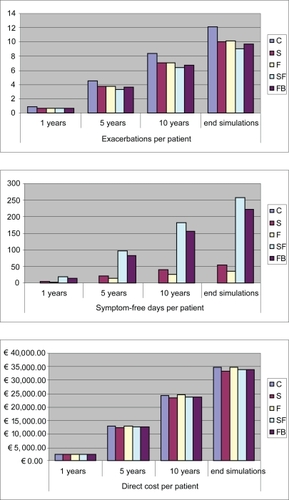
Table 5 Incremental cost effectiveness ratio (ICER) calculation with respect to the less expensive strategy (S)
Table 6 Base case and threshold values of model parameters that can cause strategy dominancy loss more rapidly