Figures & data
Figure 1 Thin-section CT scan of a smoker with chronic cough associated with chronic obstructive pulmonary disease. The segmental bronchial walls (white arrow) in the upper lobes are thickened. Early centrilobular emphysema is also present.
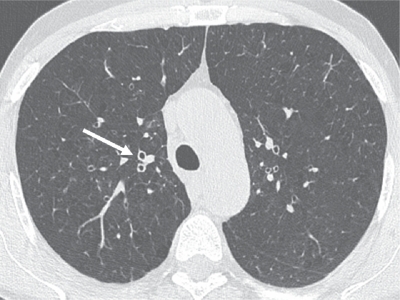
Figure 2 α1-Antitrypsin deficiency associated panlobular emphysema. There is a generalized decreased attenuation of the lung parenchyma and a striking paucity of pulmonary vasculature. Bronchiectasis are more prominent in the left lower lobe and coexist with patchy consolidation (probable infection). It is worth keeping in mind that panlobular emphysema shows an increased prevalence and extent of long lines in comparison to patients with obliterative bronchiolitis.
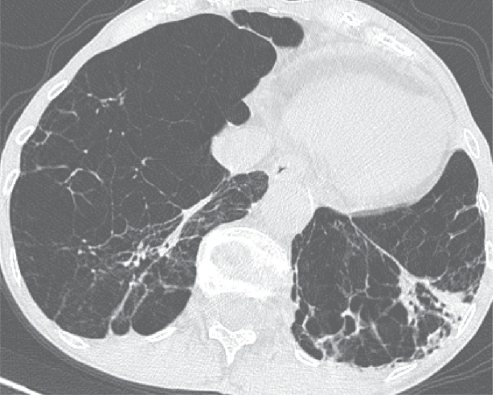
Figure 3 CT coronal reformation of a patient with symptoms of chronic bronchitis. Small bronchial diverticula (arrow) seen as outpouchings of the bronchial lumen visible along the left main bronchus.
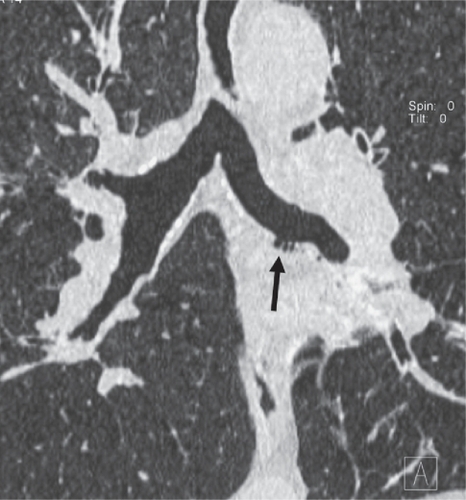
Figure 4 3D rendering of thin-section CT (postero-anterior view) scan with tracheobronchial tree (azure-blue) and both lower lobes (green) and upper lobes (red). Inside lobes all pixels of −950 HU or less are highlighted (yellow), identifying areas of emphysema. Image generated using MeVisPULMO software (www.mevis.de). (Courtesy of Jan-Martin Kuhnigk, Bremen, Germany).
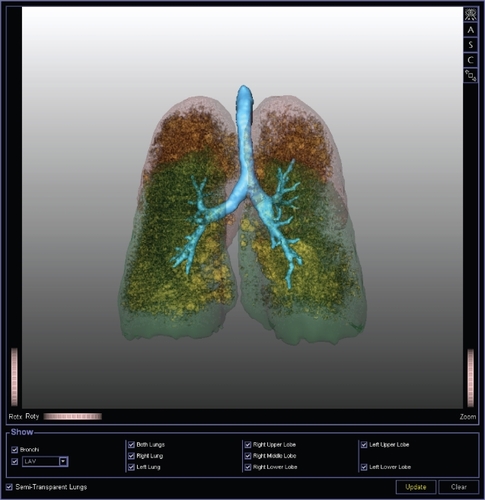
Figure 5 Tracheomalacia elicited by coughing maneuver in 65-year-old man. CT scan shows near complete collapse of airway lumen, consistent with tracheomalacia. Advanced centrilobular and paraseptal emphysema also coexist.
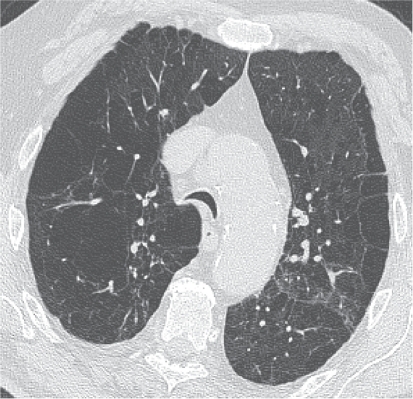
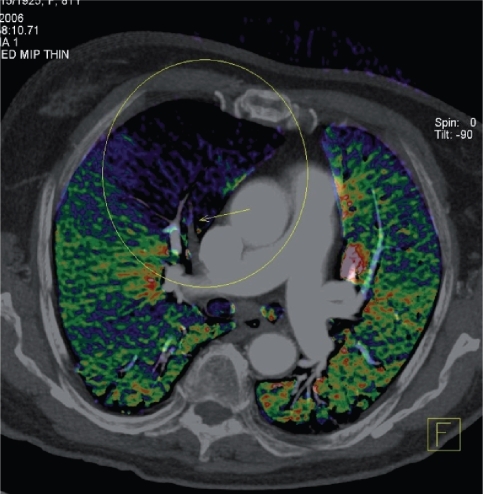
Figure 6 Example of a reconstruction from dual-energy CT in a patient presenting with an exacerbation of chronic obstructive pulmonary disease. Axial image with superimposed color-coded iodine distribution shows the lung perfusion and a defect (blue-black) caused by an occluding embolus in the right descending artery (arrow). (Courtesy of Christian Fink, MD, Munich, Germany).