Figures & data
Table 1 Contraindications to NPPV
Figure 1 Pressure volume curve showing inspiratory and expiratory arms. Note that compliance is not linear ie, it varies with lung volume. Area within the inspiratory and expiratory curve represents work of breathing (WOB).
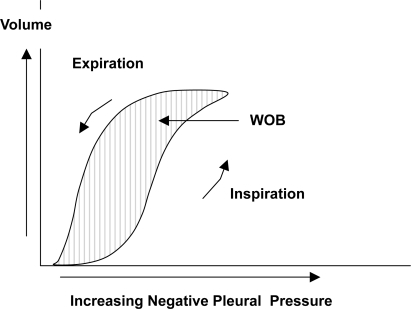
Figure 2A Effect of auto-PEEP on work of breathing (WOB). In the presence of airflow obstruction the alveoli remain inflated at end expiration. This results in alveolar pressure greater than atmospheric pressure. Without any inspiratory effort intra-pleural pressure equals alveolar pressure. A negative pressure greater than the auto-PEEP is required for the airflow to begin.
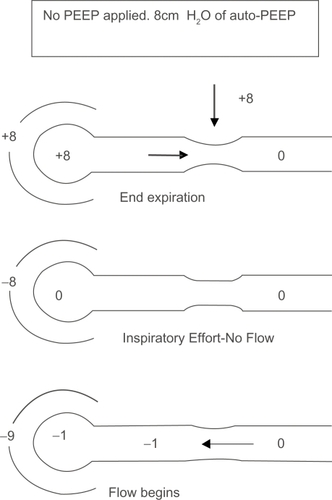
Figure 2B Applying external PEEP helps reduce WOB. Effect of adding external PEEP. Extrinsically applied PEEP reduces the amount of negative pressure needed to generate airflow.
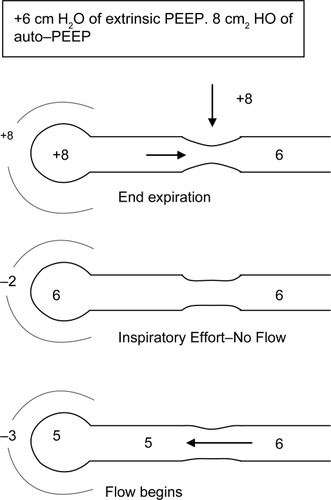
Figure 3 The waterfall analogy to explain the rationale behind applying external PEEP equal to or less than auto-PEEP. The waterflow (airflow) is not affected until the downstream water (external PEEP) reaches the critical pressure. External PEEP applied at the airway will not worsen auto-PEEP if it does not exceed critical pressure.
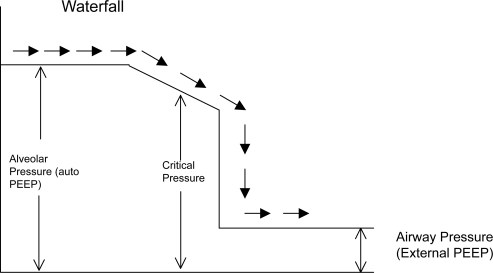
Figure 4 Expiratory hold maneuver to estimate auto-PEEP. The valves are shut off at the end of expiration. When the flow equals zero the pressure rises to the total PEEP level. Subtracting any external PEEP, if applied, from the total PEEP gives the value of auto-PEEP.
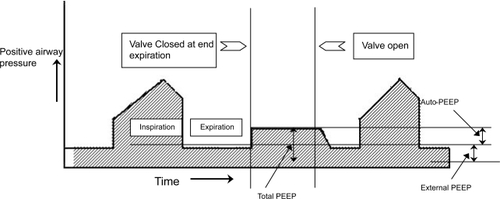
Figure 5 Static and Dynamic auto-PEEP. In Dynamic auto-PEEP inspiratory flow begins as soon as the airway pressure is greater than the lung region with lowest auto-PEEP ie, shortest time constant (Dynamic auto-PEEP in this example is 5). In static auto PEEP end expiratory occlusion allows for equilibration of lung regions and the auto-PEEP measured is an average of all regions (Static auto-PEEP in this example is 10).
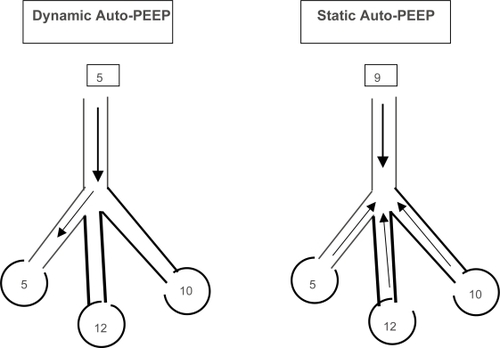
Figure 6 Measurement of resistance and compliance. The valve is occluded at end inspiration and the airway pressure declines from a peak (Ppeak) to a plateau when there is zero airflow. Airflow rates can be measured simultaneously.
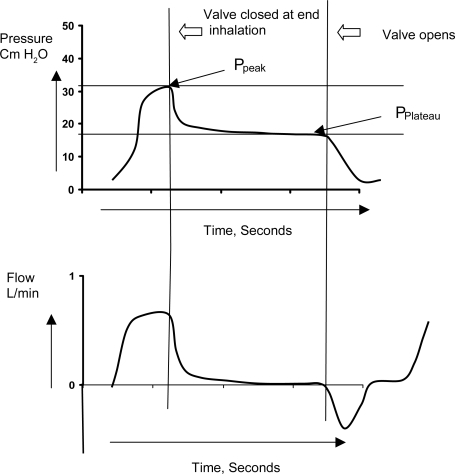
Figure 7 Measurement of trapped volume. In normal subjects the lung volume returns to functional residual capacity (FRC). However in the presence of dynamic hyperinflation the end expiratory volume remains higher than FRC and tidal breathing occurs at higher lung volumes. After a tidal breath prolonged apnea is instituted and the volume of exhaled air is measured. Subtracting the tidal volume (VT) from the volume at end inspiration (VEI) gives the amount of trapped volume (VTrap).
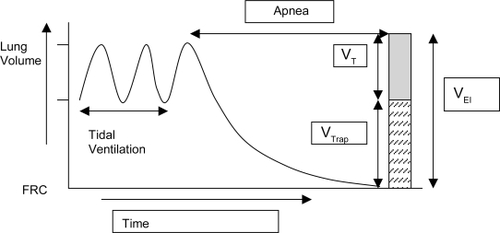
Table 2 Key points on ventilatory techniques to optimize mechanical ventilation in COPD