Figures & data
Figure 1 Abnormal morphology, elastic fiber accumulation, and elastin mRNA expression in CBO. Sections of peripheral lung tissue from CBO-affected lung (panels A and B), and control lung (panel C) were fixed without inflation, embedded, and sectioned at 5 μM. Serial sections were stained with H and E (A, B, C), for elastic fibers using Hart’s elastic fiber stain (A′, B′, C′), and hybridized in situ for elastin mRNA (A″, B″, C″). In panel A, a large vessel (top of each panel) is flanked by a large airway (bottom left of each panel) with accumulation of particulates, visible as black deposits, between the vessel and airway (indicated by white arrow in A and A′). A′ shows elastic laminae (stained black) in the intralobar pulmonary artery, and an increased density of elastic fibers beneath the epithelium of the large airway and the surrounding lung parenchyma compared to control (C′). A″ shows that elastin mRNA expression (black signal) is present in the large blood vessel, conducting airway, and particularly in tissue between these structures, and is significantly increased compared to control lung (C″). Panel B shows a large infiltrate (top of panels) flanked by surrounding tissue containing obliterated airways. Elastin staining in B′ indicates the infiltrate likely encompasses an airway, as there is a continuous elastic fiber (outlined by white dashed line) indicating a luminal structure has been present. Again, elastin density is increased compared to control lung (C’). B″ shows ongoing, intense elastin mRNA expression in tissue surrounding the infiltrate that is greater than that seen in control lung (C″).
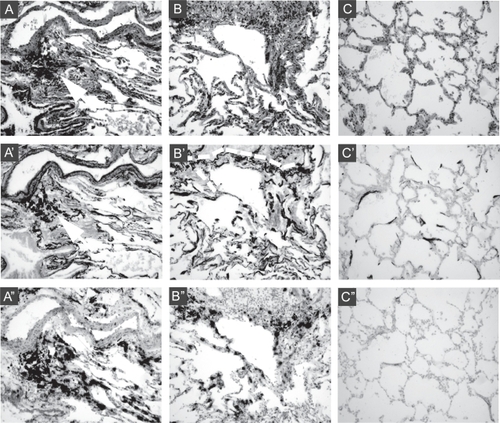
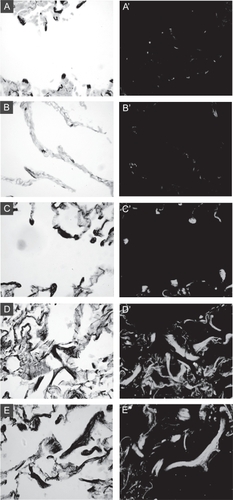
Figure 2 Altered distribution and abundance of cells expressing α-SMA in CBO lung. Serial sections of lung were stained with Hart’s elastin stain (left panels) or for a-SMA (right panels). A: Alveolar section from a control lung specimen showing focal elastic fibers (black stained) at tips of alveolar walls (grey counterstain). A′: Serial section stained for a-SMA shows small alveolar myofibroblasts localizing to alveolar tips. B: Emphysematous lung specimen with diminished complexity, enlarged airspaces, and less elastin staining. B′ shows loss of focal staining for a-SMA. C: Alveolar region from CBO lung shows large focal elastic fibers at alveolar septal tips, and C′ shows enlarged myofibroblasts at the same sites staining intensely for a-SMA. D and E: Remodeled regions of CBO lung showing accumulation of thick elastic fibers. D′ and E′: The elastic fibers are surrounded by cells staining intensely for a-SMA.