Figures & data
Figure 1 Histogram of the distribution of the residual volume (RV) over total lung capacity (TLC) ratio in the COPD group under study (n = 40). The 4 left-most bars constitute the Hyp– group (n = 20) and the 3 right-most bars constitute the Hyp+ group (n = 20).
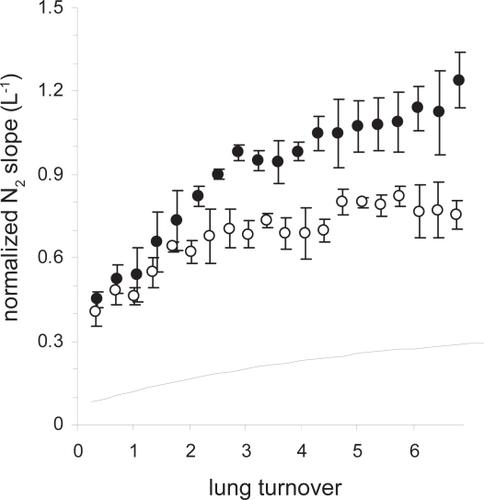
Table 1 Characteristics of COPD subgroups with RV/TLC ≥ 55% (Hyp+) OR <55% (Hyp−) and the effect of tiotropium
Figure 2 A: Scatterplot of the individual change in IC (ΔIC) versus the corresponding change in visual analog dyspnea score (ΔVAS) in the Hyp+ group where ΔIC and ΔVAS are computed as the VAS or pre-tiotropium IC value at the 6 weeks tiotropium visit minus the VAS or pre-tiotropium IC value at the baseline study visit. B: Scatter-plot of the individual change in sGaw (ΔsGaw) versus the corresponding change in visual analog score (ΔVAS) in the Hyp+ group; same representation as in A.
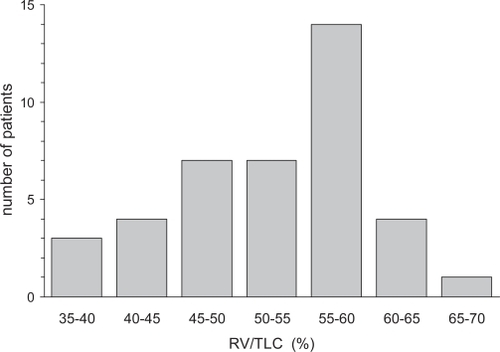
Figure 3 A: Forced expiratory volume in one second (FEV1) as %predicted obtained from the Hyp+ group on the screening visit (dotted line connecting open triangles; pre- and 90 min post-dilation with a combination of salbutamol and ipratropium bromide) and during the three study visits (solid lines connecting open circles (pre-) and closed circles (90 min post-) tiotropium); the crosses refer to intermediate FEV1measures after 60 min. On the first study visit, patients were tiotropium-free, while the other two study visits followed 3 and 6 weeks of tiotropium once-daily treatment with the last tiotropium intake on the day prior to the study visit; asterisks indicate any significant change 90 min after tiotropium (2-way ANOVA with Bonferroni; p < 0.05). B: FEV1obtained from the Hyp− group.
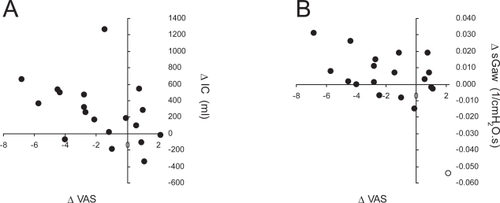
Figure 4 A: Inspiratory capacity measured in an open circuit (IC) obtained from the Hyp+ group on the screening visit (dotted line connecting open triangles; pre- and 90 min post-dilation with a combination of salbutamol and ipratropium bromide) and during the three study visits (solid lines connecting open circles (pre-) and closed circles (90 min post-) tiotropium). On the first study visit, patients were tiotropium-free, while the other two study visits followed 3 and 6 weeks of tiotropium once-daily treatment with the last tiotropium intake on the day prior to the study visit; asterisks indicate any significant change 90 min after tiotropium (2-way ANOVA with Bonferroni; p < 0.05); the dotted line represents the predicted IC value for this subgroup. B: IC obtained from the Hyp− group.
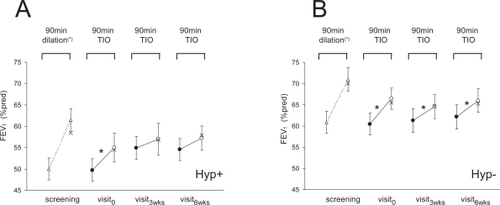
Figure 5 A: Specific conductance (sGaw) obtained from the Hyp+ group on the screening visit (dotted line connecting open triangles; pre- and 90 min post-dilation with a combination of salbutamol and ipratropium bromide) and during the three study visits (solid lines connecting open circles (pre-) and closed circles (90 min post-) tiotropium). On the first study visit, patients were tiotropium-free, while the other two study visits followed 3 and 6 weeks of tiotropium once-daily treatment with the last tiotropium intake on the day prior to the study visit; asterisks indicate any significant change 90 min after tiotropium (2-way ANOVA with Bonferroni; p < 0.05). B: sGaw obtained from the Hyp− group.

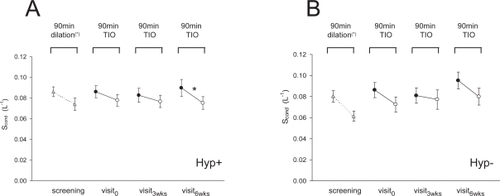
Figure 6 A: Conductive ventilation heterogeneity (Scond) obtained from the Hyp+ group on the screening visit (dotted line connecting open triangles; pre- and 90 min post-dilation with a combination of salbutamol and ipratropium bromide) and during the three study visits (solid lines connecting open circles (pre-) and closed circles (90 min post-) tiotropium). On the first study visit, patients were tiotropium-free, while the other two study visits followed 3 and 6 weeks of tiotropium once-daily treatment with the last tiotropium intake on the day prior to the study visit; asterisks indicate any significant change 90 min after tiotropium (2-way ANOVA with Bonferroni; p < 0.05). B: Scond obtained from the Hyp− group.
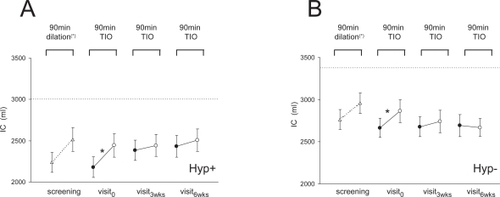
Table 2 Characteristics of FEV1 matched subgroups with RV/TLC ≥ 55% (Hyp+) OR < 55% (Hyp−) and the effect of tiotropium
Table 3 Characteristics of COPD subgroups with RV/TLC > 59% (Hyp+) or <46% (Hyp−) and the effect of tiotropium
Figure A1 Normalized N2 phase III slopes (mean ± SD) as a function of lung turnover obtained in two patients participating in this study (open and closed circles); also represented is an idealized curve corresponding to normal normalized N2 phase III slopes (dotted line).