Figures & data
Table 1 Characteristics of the study population in relation to CRP values
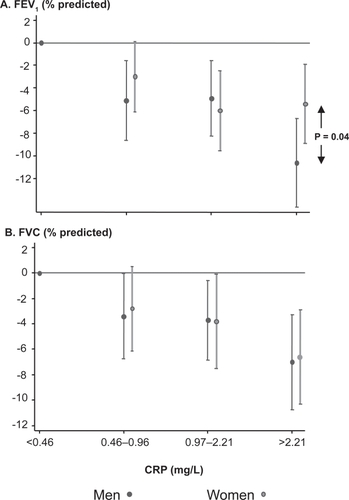
Figure 1 Correlation between pack years and CRP in ex- and current smokers.
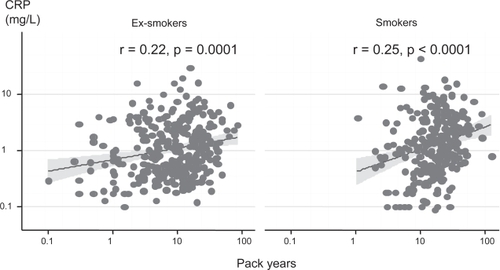
Table 2 Prevalence of GOLD stage 0 and COPD and the independent association to CRP
Figure 2 Correlation between CRP values and FEV1 expressed as % of the predicted in subjects with COPD (n = 53).
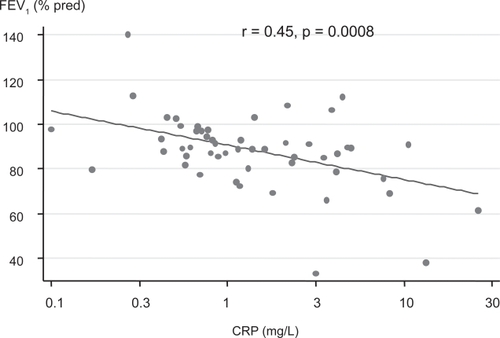
Table 3 Estimated effect (95% CI) of CRP on lung function. Subjects with CRP value ≤ 0.45 mg/L are the reference group. The values are adjusted for centre, age, (age)2, height, BMI and pack years (estimate in mL (95% CI))
Table 4 Estimated effect (95% CI) of CRP on annual decline in FEV1 (mL/year). Subjects with CRP value ≤ 0.45 mg/L are the reference group. The values are adjusted for centre, age, (age)2, height, BMI at baseline, change in BMI and pack years
Figure 3 Estimated difference in FEV1 (A) and FVC (B) between subjects with different CRP values, where subjects in the 1st CRP quartile are the reference. The estimates are adjusted for age, sex, BMI and pack years.