Figures & data
Table 1 Classification criteria for GOLD and FEV1/ht2 staging from spirometry alone. FEV1% is the FEV1 expressed as a percentage of FVC. FEV1PP is the FEV1 expressed as a percentage of the subject’s predicted value
Table 2 Descriptive data for age, height and spirometric values for the 1095 patients in the study (644 female) showing mean, standard deviation (SD) and median values
Table 3 Univariate analysis: Indices that were found by Cox regression to be univariate predictors of survival with χ2 value for strength of prediction and its significance value
Table 4 Multivariate analysis: The table shows the covariate hazard ratios (HR) for death (with 95% confidence limits) for Cox proportional hazards models using sex and the quintiles of age and various methods for expressing FEV1 impairment. The HR values are contrasts against the hazard estimated for the first stage of each group and for male contrasted with female. Chi-square values are shown for each model
Table 5 Cross tabulation of concordance in the 1095 subjects between GOLD classification (GOLD stages 0 to 4) and FEV1/ht2 classification for COPD severity. The table shows the number of subjects dying (nd) under follow up as a fraction of the total number N within that group (nd/N), the estimated Kaplan-Meier mean survival for that group as years in bold and the 95% confidence limits for the estimate in parenthesis. Aggregate results for each columns and row as a whole are also shown
Figure 1 The mean survival for each FEV1/ht2 group and each GOLD stage with 95% confidence limit bars and the number of subjects in each column.
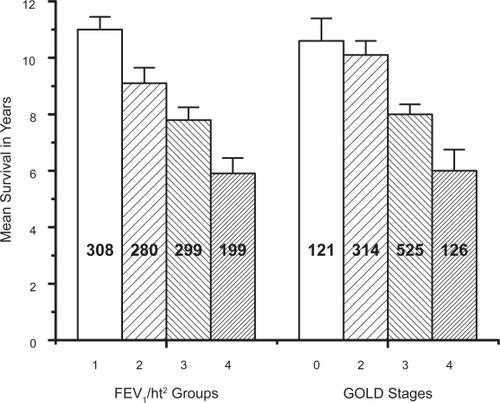
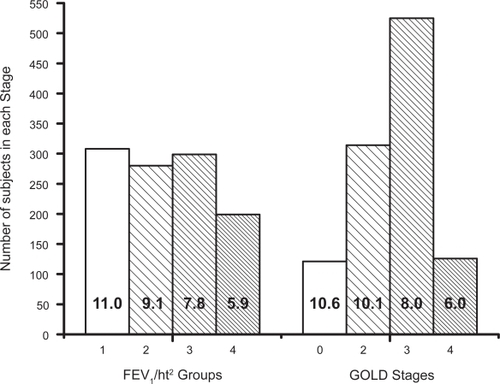
Figure 2 Plot of the number of subjects in each of the groups for the FEV1/ht2 staging system on the left and the GOLD staging system on the right with the mean survival of each group stated inside the relevant column.