Figures & data
Figure 1 Study design.
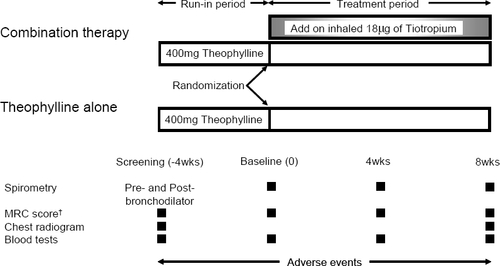
Table 1 Characteristics of patients with COPD at baseline
Figure 2 Trial profile.
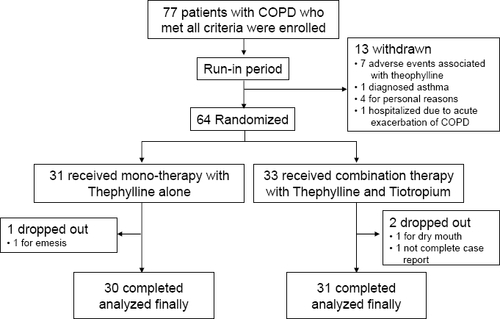
Figure 3 Changes in FVC and FEV1 in the theophylline alone (white squares) and the combination therapy group (black squares). In a and b, absolute values of FVC and FEV1 are shown. In c and d, percentage changes in FVC and FEV1 from the baseline are shown.
Abbreviations: FVC, forced vital capacity; FEV1, forced expiratory volume in one second.
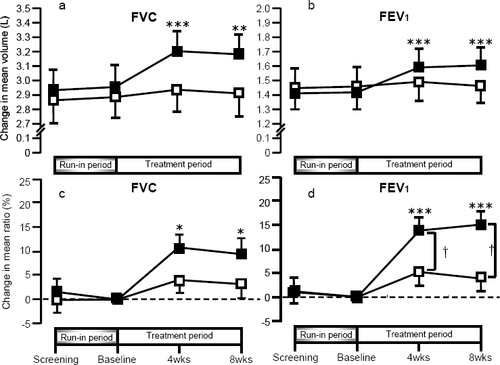
Figure 4 Changes in FVC and FEV1 in the theophylline-alone (white squares, n = 17) and the combination therapy group (black squares, n = 25), in patients who did not receive regular treatment with theophylline at the time of screening. In a and b, absolute values of FVC and FEV1 are shown. In c and d, percentage changes in FVC and FEV1 from the baseline are shown.
Abbreviations: FVC, forced vital capacity; FEV1, forced expiratory volume in one second.
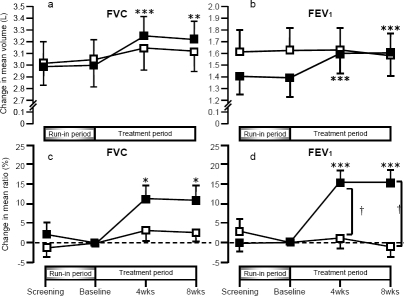
Figure 5 Changes in VC, IC, PEFR, ⩒50 and ⩒25 at 8 weeks. Changes in VC, IC, PEFR, ⩒50, and ⩒25 at 8 weeks were analyzed in theophylline-alone (white bars, n = 26) and combination therapy (solid bars, n = 30) groups.
Abbreviations: IC, inspiratory capacity; PEFR, peak expiratory flow rate; VC, vital capacity.
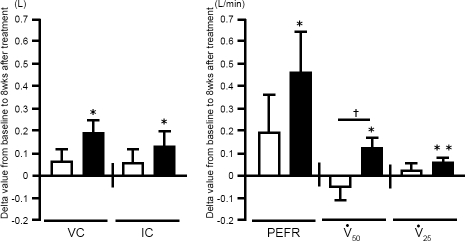
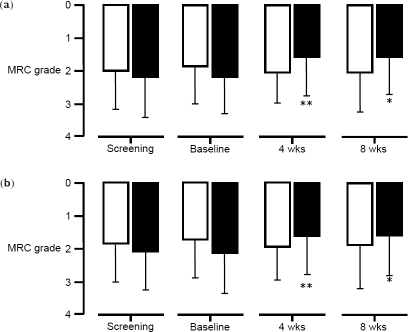
Figure 6 British Medical Research Council (MRC) scores 4 and 8 weeks after the addition of tiotropium. (a) MRC scores 4 and 8 weeks after the addition of tiotropium were analyzed in theophylline-alone (white bars, n = 29) and combination therapy (solid bars, n = 30) groups. (b) MRC scores 4 and 8 weeks after the addition of tiotropium were analyzed in 42 patients who were not receiving theophylline at the time of screening: theophylline-alone (white bars, n = 17) and combination therapy (solid bars, n = 25).