Figures & data
Figure 1 Plasma α1-antitrypsin, FEV1 decline, and risk of airway obstruction or COPD by α1-antitrypsin genotype. Values are mean ± SEM, odds ratio [OR] (95% CI), or hazard ratio [HR] (95% CI). ***p < 0.001, **p < 0.01, *p < 0.05. Data derived from Dahl M, Tybjaerg-Hansen A, Lange P, Vestbo J, Nordestgaard BG. Ann Intern Med. 2002;136:270–279.Citation18
![Figure 1 Plasma α1-antitrypsin, FEV1 decline, and risk of airway obstruction or COPD by α1-antitrypsin genotype. Values are mean ± SEM, odds ratio [OR] (95% CI), or hazard ratio [HR] (95% CI). ***p < 0.001, **p < 0.01, *p < 0.05. Data derived from Dahl M, Tybjaerg-Hansen A, Lange P, Vestbo J, Nordestgaard BG. Ann Intern Med. 2002;136:270–279.Citation18](/cms/asset/416b1431-88eb-4398-bb7a-4c0246ada762/dcop_a_3106_f0001_b.jpg)
Figure 2 Cross-sectional and case-control studies of COPD risk in protease inhibitor MS, MZ, and SZ heterozygotes versus MM individuals. Box sizes are proportional to inverse-variance weights (random effects model). Lines represent 95% confidence intervals. Adapted with permission from Dahl M, Hersh CP, Ly NP, Berkey CS, Silverman EK, Nordestgaard BG. Eur Respir J. 2005;26:67–76.Citation20 Copyright © 2005 European Respiratory Society Inc, and from Hersh CP, Dahl M, Ly NP, Berkey CS, Nordestgaard BG, Silver-man EK. Thorax. 2004;59:843–849.Citation21 Copyright © BMJ Publishing Group.
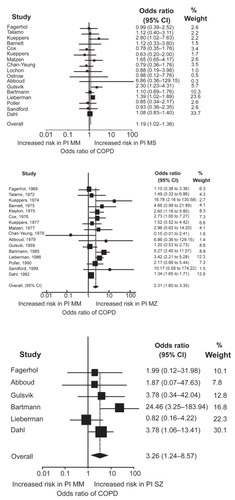
Figure 3 Levels of FEV1 and FVC by cystic fibrosis F508del carrier status. Values are means ±SEM, based on 10-year age groups. Number of measurements: F508del, n = 270; and noncarriers, n = 10,002. P-values are by general linear repeated-measures analysis comparing F508del heterozygotes versus noncarriers. Adapted with permission from Dahl M, Nordestgaard BG, Lange P, Tybjaerg-Hansen A. J Allergy Clin Immunol. 2001;107:818–823.Citation24 Copyright © Elsevier.
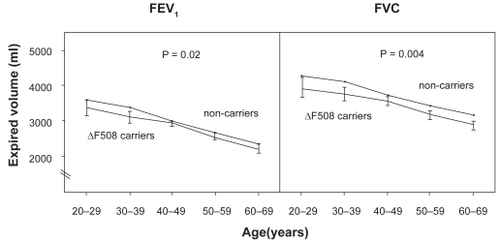
Figure 4 Odds ratios for asthma and COPD in cystic fibrosis F508del heterozygotes versus noncarriers in the 1976 to 1978, 1981 to 1983, and 1991 to 1994 examinations of the Copenhagen City Heart Study. Multiple logistic regression analyses allowed for age, sex, tobacco consumption, passive smoking history, and familial asthma. “Total” refers to disease diagnosed at at least one examination. Adapted with permission from Dahl M, Nordestgaard BG, Lange P, Tybjaerg-Hansen A. J Allergy Clin Immunol. 2001;107:818–823.Citation24 Copyright © Elsevier.
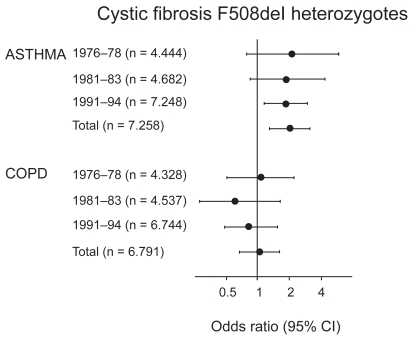
Figure 5 Cross-sectional and case-control studies of asthma risk in cystic fibrosis/F508del heterozygotes. Box sizes are proportional to inverse-variance weights (random effects model). Lines represent 95% confidence intervals.
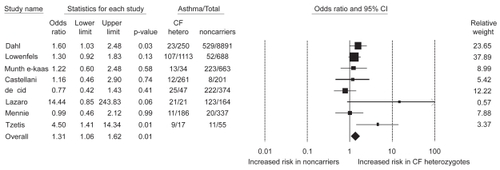
Figure 6 Hazard ratios for asthma and COPD by mannose-binding lectin deficiency. Adapted with permission from Dahl M, Tybjaerg-Hansen A, Schnohr P, Nordestgaard BG. J Exp Med. 2004;199:1391–1399.Citation44 Copyright © 2004 Rockefeller University Press.
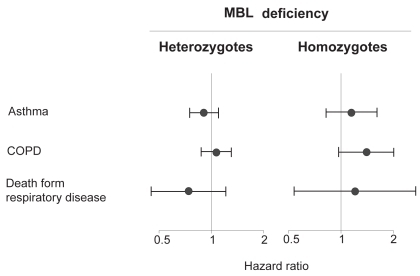
Figure 7 Kaplan-Meier curves showing rate of COPD hospitalizations during follow-up. Number at risk at the beginning of each year is shown below the horizontal axis. P < 0.001 for plasma fibrinogen >3.3 g/L versus <2.7 g/L, P = 0.003 for >3.3 g/L versus 2.7–3.3 g/L, and p = 0.31 for 2.7-3.3 g/L versus <2.7 g/L on log-rank test. Adapted with permission from Dahl M, Tybjaerg-Hansen A, Vestbo J, Lange P, Nordestgaard BG. Am J Respir Crit Care Med. 2001;164:1008–1011.Citation54 Copyright © 2001 American Thoracic Society.
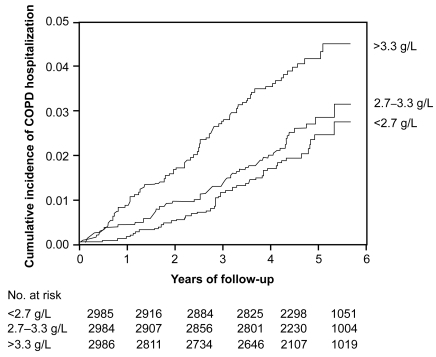
Figure 8 Cumulative incidence of COPD events according to baseline serum CRP levels. Cumulative incidences of COPD hospitalization and death were increased in individuals with baseline CRP > 3 mg/L versus ≤3 mg/L. Adapted with permission from Dahl M, Vestbo J, Lange P, Bojesen SE, Tybjaerg-Hansen A, Nordestgaard BG. Am J Respir Crit Care Med. 2007;175:250–255.Citation55 Copyright © 2007 American Thoracic Society.
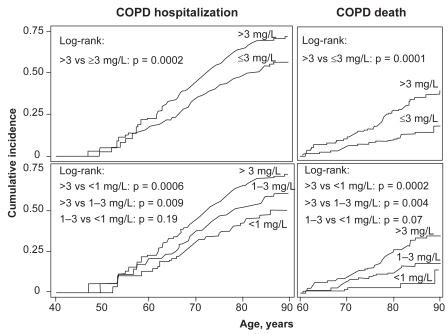
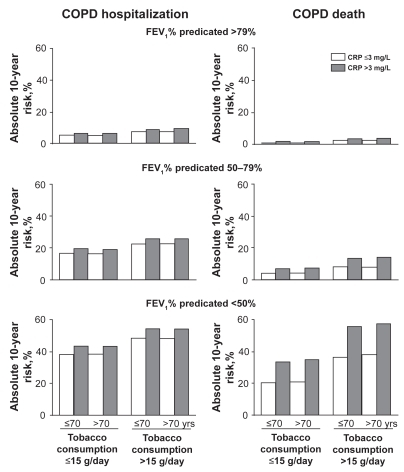
Figure 9 Absolute 10-year risks of COPD hospitalization and COPD death according to FEV1% predicted, tobacco consumption, age, and serum CRP. The dependent variables for the Poisson regressions are number of COPD hospitalizations or COPD deaths during the subsequent 10 years. The highest absolute 10-year risks for COPD hospitalization and death – 54% and 57% – were found among individuals with CRP > 3 mg/L, above 70 years of age, with tobacco consumption > 15 g/day, and FEV1%predicted <50%. Adapted with permission from Dahl M, Vestbo J, Lange P, Bojesen SE, Tybjaerg-Hansen A, Nordestgaard BG. Am J Respir Crit Care Med. 2007;175:250–255.Citation55 Copyright © 2007 American Thoracic Society.