Figures & data
Table 1 Clinical trials included in the pooled Tiotropium HandiHaler® analysis
Table 2 Baseline characteristics of patients in the placebo and tiotropium groups
Table 3 Baseline concomitant respiratory medications in the placebo and tiotropium groups
Table 4 Incidence rates and rate differences (tiotropium–placebo) per 100 patient-years for adverse events, serious adverse events and fatal adverse events
Table 5 Incidence rates and rate differences (tiotropium–placebo) per 100 patient-years for adverse events according to selected organ systems and adverse event endpoints
Table 6 Incidence rates and rate differences (tiotropium–placebo) per 100 patient–years for serious adverse events cases according to selected organ systems and adverse event endpoints
Table 7 Incidence rates and rate differences (tiotropium–placebo) per 100 patient-years for a major adverse cardiovascular event
Table 8 Incidence rates and rate differences (tiotropium–placebo) per 100 patient-years for potential anticholinergic adverse events
Table 9 Incidence rates and rate differences (tiotropium–placebo) per 100 patient-years for potential anticholinergic serious adverse events
Figure 1 Incidence rates, rate differences (tiotropium–placebo), and 95% confidence intervals (CI) for all-cause mortality in 26 Tiotropium HandiHaler® trials (total and within each trial).
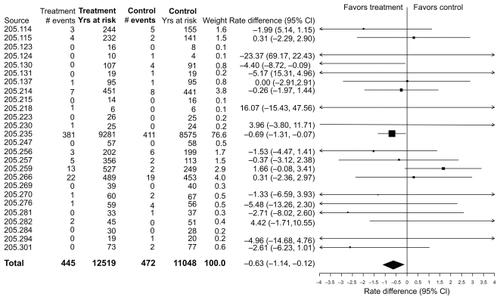
Table 10 Incidence rates and rate differences (tiotropium–placebo) per 100 patient-years for fatal cases according to organ system with a frequency of at least 3% of the total number of fatal cases
Table 11 Incidence rates and rate differences (tiotropium–placebo) per 100 patient-years for fatal cases by term with a frequency of at least 10 fatal cases