Figures & data
Table 1 Patient characteristics of the patients who had an exacerbation during the trial (n = 45), and of the total study population (n = 114)
Table 2 Cellular inflammatory parameters
Table 3 Inflammatory biomarkers
Table 4a Differences between bacterial and non-bacterial exacerbations (sputum parameters)
Table 4b Differences between bacterial and non-bacterial exacerbations (blood parameters)
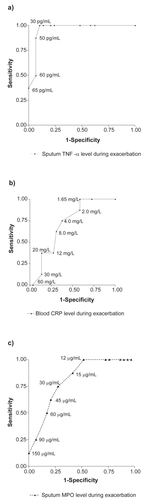
Figure 1 Receiver operating characteristic curves for distinguishing a bacterial cause of exacerbations with inflammatory markers. On the curve, several biomarker concentration levels are presented, which provides an indication for optimal cut-off points and their corresponding predictive values. a) sputum tumor necrosis factor-α (TNF-α), b) blood C-reactive protein (CRP), c) sputum myeloperoxidase (MPO).