Figures & data
Table 1 Baseline characteristics of the study patients
Table 2 Pulmonary function at the baseline visit and one-year visit
Figure 1 FEV1 % predicted for each patients at the baseline and year 1 visit.
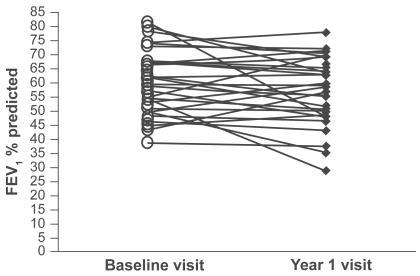
Table 3 Repeatability of systemic measurements over the one year interval
Figure 2 Bland–Altman plots for a) IL-6, b) CRP and c)TNFα collected with a one year interval. The dotted lines represent the mean difference ± 2 SD.
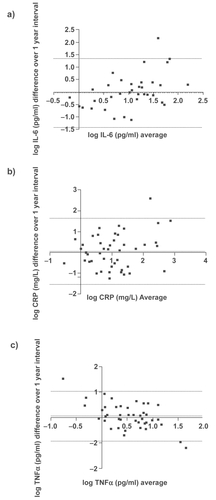
Table 4a Relationships between systemic inflammatory biomarkers and BMI at the baseline visit
Table 4b Relationships between systemic inflammatory biomarkers and BMI at the one-year visit
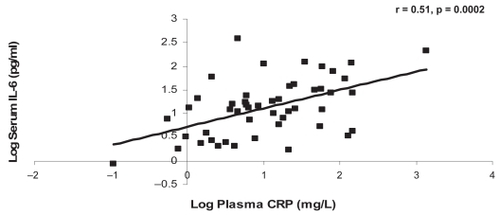
Figure 3a The relationship between CRP and IL-6 at the baseline visit.
Abbreviations: CRP, C-reactive protein; IL-6, interleukin-6.
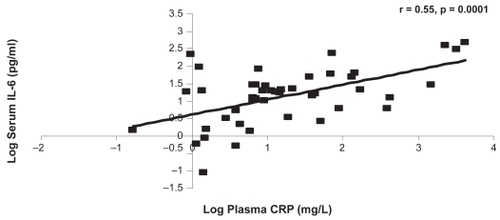
Figure 3b The relationship between CRP and IL-6 at the one-year visit.