Figures & data
Figure 1 Seventy scale for COPD.
Abbreviations: COPD, chronic obstructive pulmonary disease; GOLD, Global Initiative for Chronic Obstructive Lung Disease; FEV1, forced expiratory volume in one second; FVC, forced vital capacity; RLD, restrictive lung disease.
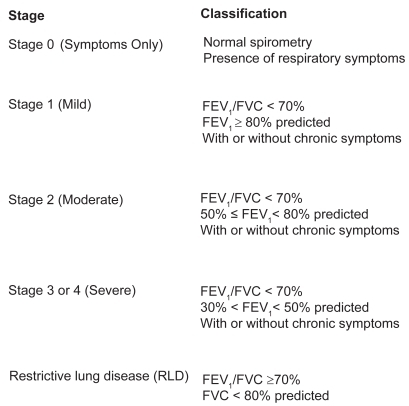
Table 1 Demographics and description of key variables. All figures are column percentages except for counts (n, died) and age
Figure 2 Kaplan–Meier survival curves of all 6,261 participants age 50 and over in NHANES III, stratified by lung function impairment.
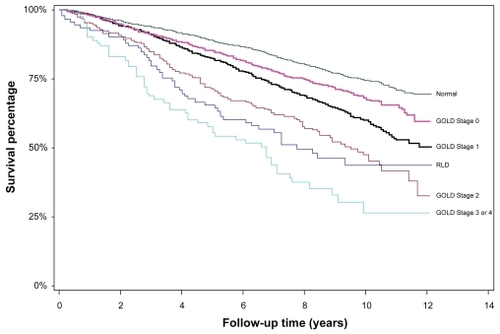
Figure 3 Kaplan–Meier survival curves of 1,294 current smokers age 50 and over in NHANES III, stratified by lung function impairment.
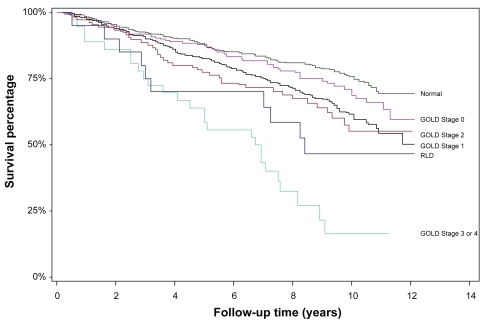
Figure 4 Kaplan–Meier survival curves of 2,261 former smokers age 50 and over in NHANES III, stratified by lung function impairment.
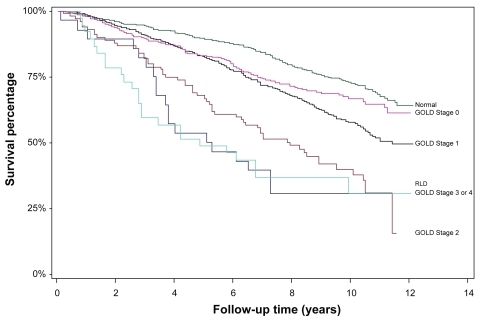
Figure 5 Kaplan–Meier survival curves of 2,706 never smokers age 50 and over in NHANES III, stratified by lung function impairment.
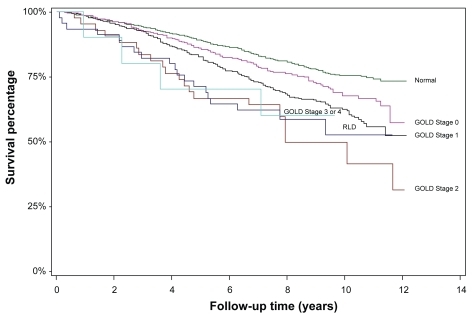
Table 2 Excess deaths rates from –, relative to persons with no lung disease
Table 3 Relative risks from multivariable Cox proportional hazards regressions models
Table 4 Mortality rates for otherwise healthy 65-year-old Caucasian males based on the models of
Table 5 Excess death rates for otherwise healthy 65-year-old Caucasian males, computed as less the mortality rates for males aged 65 in the general population (0.0186)
Table 6 Mortality rates for otherwise healthy 65-year-old Caucasian females based on the models of
Table 7 Excess death rates for otherwise healthy 65-year-old Caucasian females, computed as less the mortality rates for females aged 65 in the general population (0.0120)
Table 8 Life expectancies for otherwise healthy 65-year-old Caucasian males, based on the rates in and . See also
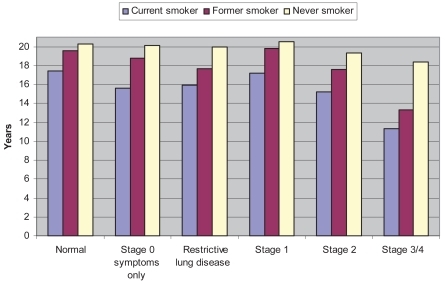
Figure 6 Male life expectancy at age 65, stratified by smoking status and severity of COPD (See ).
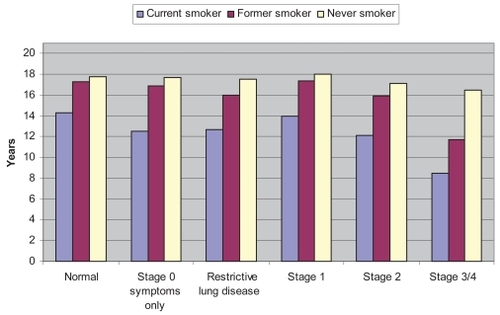
Table 9 Life expectancies for otherwise healthy 65-year-old Caucasian females, based on the rates in and . See also
Figure 7 Female life expectancy at age 65, stratified by smoking status and severity of COPD (See ).