Figures & data
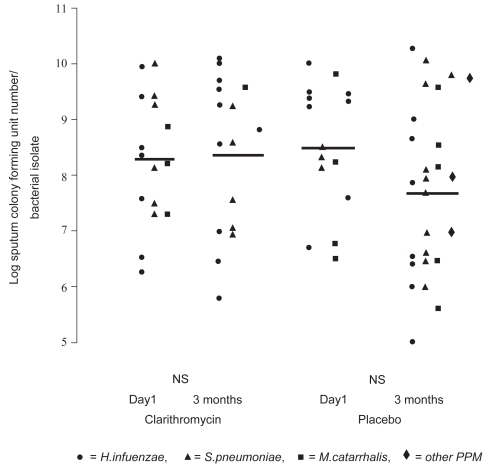
Figure 1 Molecular structure of 14 member macrolides (erythromycin, A), fifteen member compounds (azithromycin, B) and a 16 member compound (C) (CitationJaffe and Bush 2001).
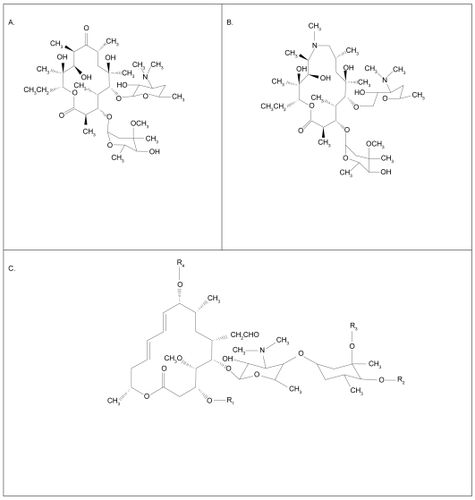
Figure 2 Molecular targets of macrolides (CitationTsai and Standiford 2004).
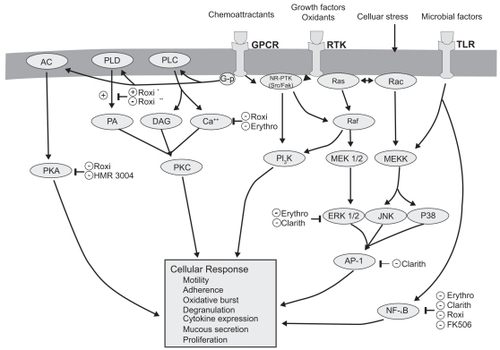
Table 1 Anti-inflammatory and bacterial virulence effects of macrolide antibiotics
Figure 3 Potential beneficial effects of macrolides in COPD patient.
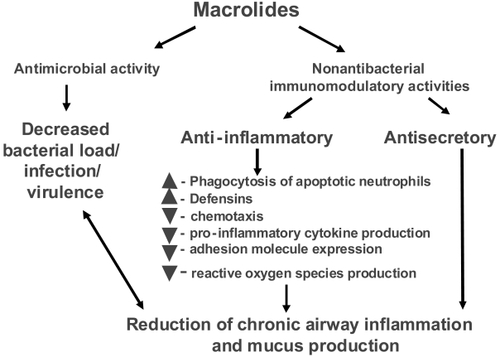
Table 2 Effect of 12 months of erythromycin therapy on common colds and AECOPDs in patients with COPD
Table 3 Effect of azithromycin prophylactic therapy in COPD patients at high risk of AECOPD and treatment failure
Figure 4 Levels of induced-sputum inflammatory markers in clarithromycin- and placebo-treated COPD patients before and after treatment. AT, after treatment; BT, before treatment; IL-8, interleukin-8; LTB4, leukotriene B4; TNF-α, tumor necrosis factor-α. *p < 0.05 before versus after treatment. Copyright © 2004. Reproduced with permission from CitationBasyigit I, Yildiz F, Ozkara SK, et al. 2004. The effect of clarithromycin on inflammatory markers in chronic obstructive pulmonary disease: preliminary data. Ann Pharmacother, 38:783–92.
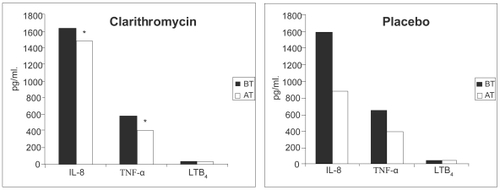
Figure 5 The effect of clarithromycin and placebo on sputum colony forming units (Cfu) numbers/bacterial (PPM) isolate. Cfu numbers are logged. Weighted bars indicate the mean for the whole group. There was no statistically significant difference between pre- and post-therapy Cfu numbers for both clarithromycin and placebo groups. NS indicates not significant. Copyright © 2004. Reproduced with permission from CitationBanerjee D, Honeybourne D, Khair OA. 2004. The effect of oral clarithromycin on bronchial airway inflammation in moderate-to-severe stable COPD: a randomized controlled trial. Treat Respir Med, 3:59–65.