Figures & data
Table 1 Included studies of gastro-protection
Table 2 COX-2 included studies
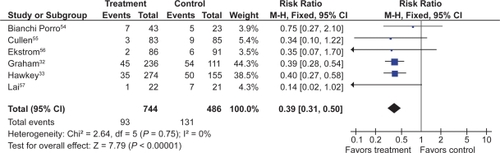
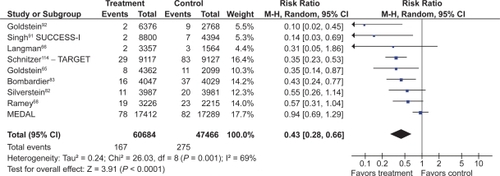
![Figure 10 PUBs (POBs [perforation, obstruction or bleeding] or symptomatic ulcer) with COX-2s vs tNSAIDs.](/cms/asset/139f5ab0-8c88-4b6c-8d20-e9d9ea5ef904/dhps_a_4334_f0010_c.jpg)
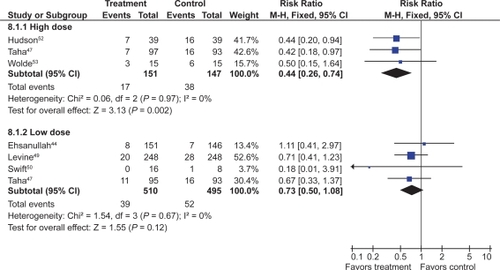
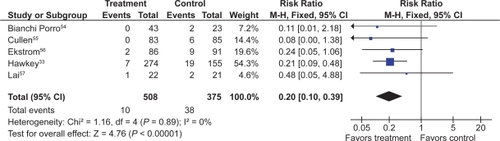
![Figure 11 Clinical ulcers (PUBs [perforation, obstruction, bleeding or the presence of a symptomatic ulcer]) with COX-2 + ASA vs tNSAID + ASA.](/cms/asset/bf78bf2b-b273-49c9-922d-171e1891703a/dhps_a_4334_f0011_c.jpg)
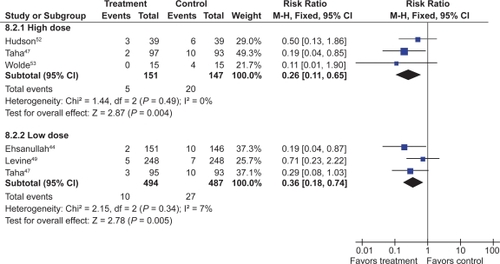
![Figure 12 Clinical ulcers (PUBs [perforation, obstruction, bleeding or the presence of a symptomatic ulcer]) with COX-2 + ASA vs COX-2 alone.](/cms/asset/9011c375-e895-4d7c-bafe-12d0b40cd05a/dhps_a_4334_f0012_c.jpg)
![Figure 13 Clinical ulcers (PUBs [perforation, obstruction, bleeding or the presence of a symptomatic ulcer]) with tNSAID + ASA vs tNSAID alone.](/cms/asset/4f38c23c-6bbd-43d1-a0e4-037b41a7f7b2/dhps_a_4334_f0013_c.jpg)