Figures & data
Table 1 Biochemical test values and MPXI values in normal response
Table 2 Biochemical test and MPXI values in pathological response
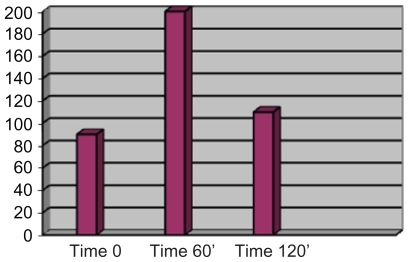
Figure 1 Glucose (mg%) and insulin levels (μUI/mL) after oral glucose tolerance test in normal response.
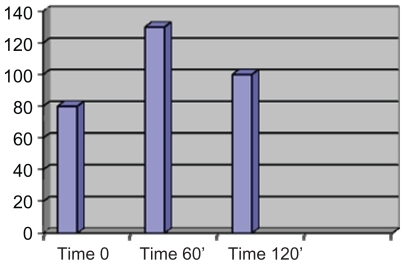
Figure 2 Insulin levels (μUI/mL) after oral glucose tolerance test in normal response.
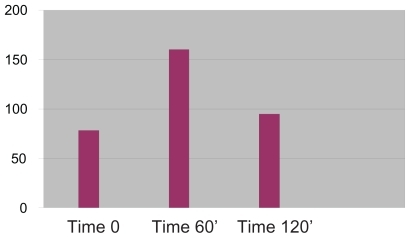
Figure 3 Glucose (mg%) after oral glucose tolerance test in pathological response.
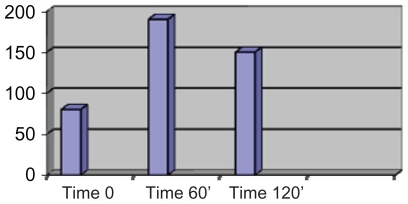
Figure 4 Insulin levels (μUI/mL) after oral glucose tolerance test in pathological response.