Figures & data
Table 1 Characteristics of 107 patients with acute childhood pyelonephritis
Table 2 Pyelonephetis progress according to procalcitonin concentration
Figure 1 Receiver operating characteristics curves for C-reactive protein (CRP), phospholipase A2 (PLa2), procalcitonin (PCT), and renal fibrosis observed by 99mTc-DMSA scintigraphy.
Note: Areas under curve (AUC) of the 3 markers were respectively (CI: 0.26163–0.72184) for CRP; 0.5475 (CI: 0.33059–0.76445) for PLa2 and 0.6240 (CI: 0.42373–0.82421) for PCT.
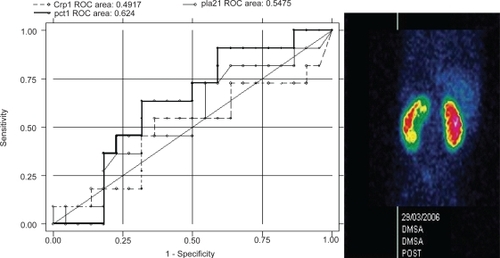
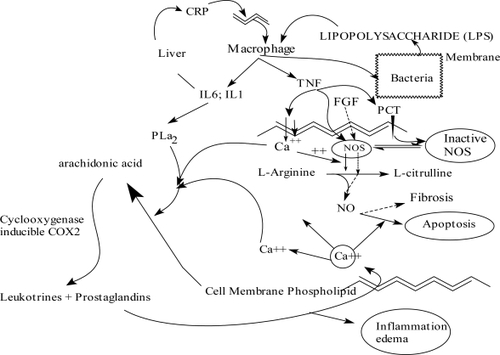
Figure 2 Physiopathology of pyelonephritis.
Abbreviations: IL, interleukin; NO, nitric oxide; NOS, NO synthase; PCT, procalcitonin; PLA2, phospholipase A2; CRP, C-reactive protein; FGF, fibroblast growth factor; TNF, tumor necrosis factor.