Figures & data
Figure 1 HPTLC chromatogram of aqueous extract of N. jatamansi.
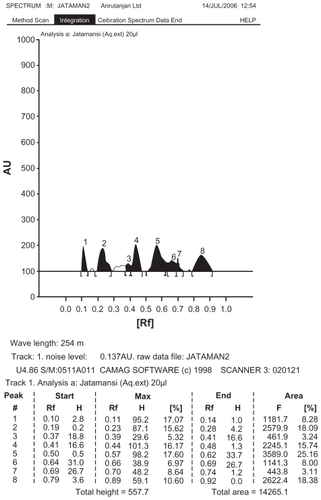
Table 3 Effect of aqueous extract of N. jatamansi on haloperidol-induced catalepsy by block method
Table 4 Effect of aqueous extract of N. jatamansi on Haloperidol induced catalepsy by metal bar test
Figure 2 HPTLC chromatogram of standard (Reference compound) Jatamansone.
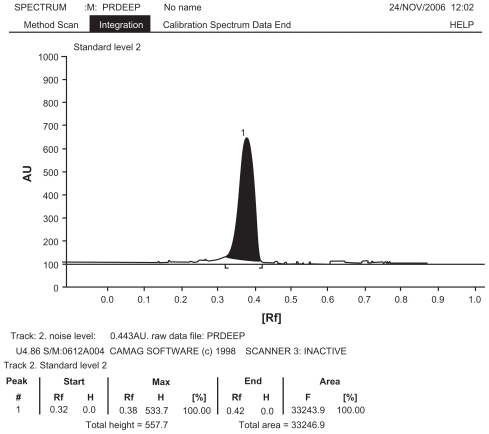
Figure 3 Histopathological slides of Brain (A control, A1 test), Liver (B control, B1 test) and Kidney (C control, C1 test), Repeated oral toxicity study of Nardostachys jatamansi treatment for 28 days in rats showed no pathological changes.
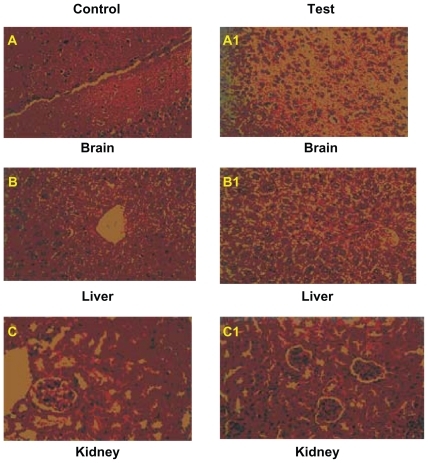
Table 1 Acute toxicity study
Table 2 Repeated oral toxicity studies
Table 5 Effect of N. jatamansi on TBARS, SOD, CAT, and GSH levels in normal and catalepsy-induced rat brain