Figures & data
Figure 1 Hydrodynamic size distribution of fullerene particles in nC60 and C60(OH)24 preparations. Shown are the volume distributions (each line is the average of at least twelve measurements per sample) of the nC60 water suspension (A), and C60(OH)24 in 10mM Nacl (B).
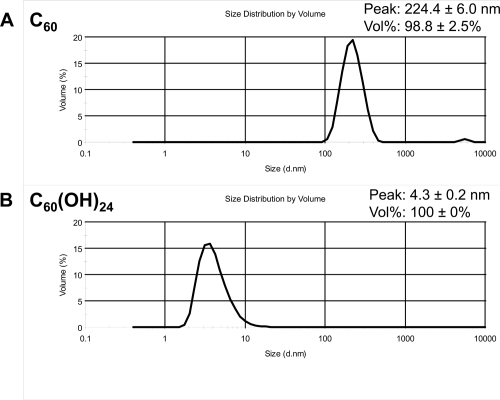
Figure 2 Flow cytometric analysis of HUVECs treated for 24 hrs with fullerenol C60 (OH)24 (100 μg/mL) or the vehicle (CTRL). Data are presented as means + SD (n = 3).
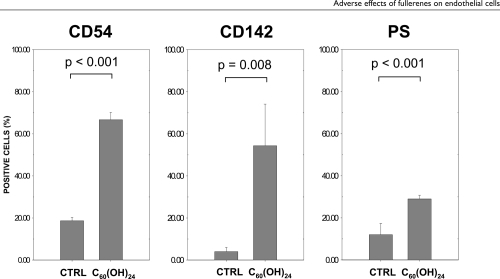
Figure 3 Cell cycle analysis of HUVECs treated 24 hrs with fullerenol C60 (OH)24 (100 μg/mL) or the vehicle (CTRL). Representative histograms of 3 experiments are shown.
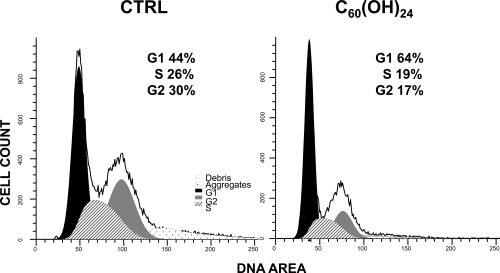
Figure 4 Flow cytometric analysis of TUNEL assay of HUVECs treated for 24 hrs with fullerenol C60 (OH)24 (100 μg/mL) or the vehicle (CTRL). Representative double fluorescence plots of 3 experiments are shown.
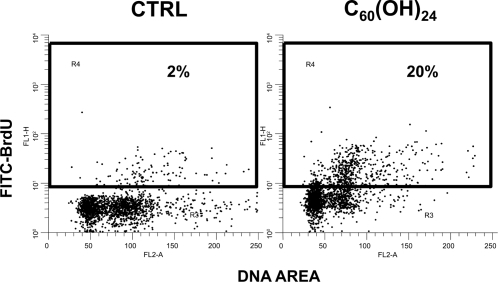
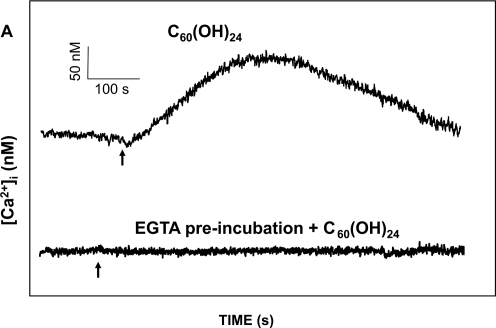
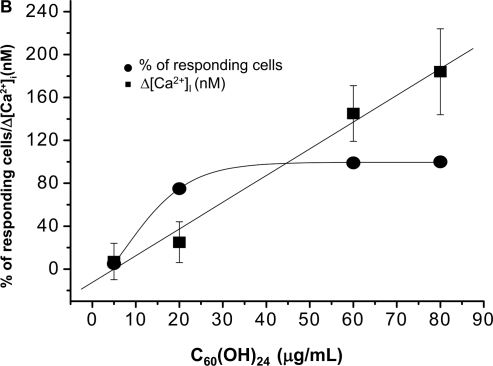
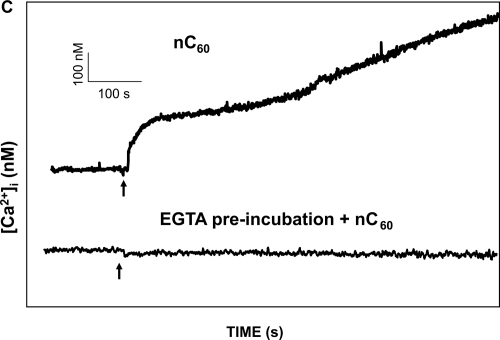
Figure 5 Analysis of C60(OH)24 and nC60 induced intracellular Ca2+ increase (Δ[Ca2+]i) in HUVECs: (A) The upper tracing shows the time course of C60(OH)24-induced Δ[Ca2+]i in a representative cell. The lower tracing shows a time course in a representative cell in a Ca2+ free solution (containing 1 mM EGTA). Arrows indicate when C60(OH)24 (final conc. 80 μg/mL) was added. There was no response observed when the fullerenol vehicle was added (not shown). (B) A dose-response curves for the effect of C60(OH)24 on Δ[Ca2+]i and the percentage of cells responded. Mean values of 30 cells ± SD are shown. (C) The upper tracing shows the time course of nC60-induced Δ[Ca2+]i in a representative cell. The lower tracing shows a time course in a representative cell in a Ca2+ free solution (containing 1 mM EGTA). Arrows indicate when nC60 (final conc. 10 μg/mL) was added. There was no response observed when the nC60 vehicle was added (not shown). (D) A dose-response curves for the effect of nC60 on Δ[Ca2+]i and the percentage of cells responded. Mean values of 30 cells ± SD are shown.
![Figure 5 Analysis of C60(OH)24 and nC60 induced intracellular Ca2+ increase (Δ[Ca2+]i) in HUVECs: (A) The upper tracing shows the time course of C60(OH)24-induced Δ[Ca2+]i in a representative cell. The lower tracing shows a time course in a representative cell in a Ca2+ free solution (containing 1 mM EGTA). Arrows indicate when C60(OH)24 (final conc. 80 μg/mL) was added. There was no response observed when the fullerenol vehicle was added (not shown). (B) A dose-response curves for the effect of C60(OH)24 on Δ[Ca2+]i and the percentage of cells responded. Mean values of 30 cells ± SD are shown. (C) The upper tracing shows the time course of nC60-induced Δ[Ca2+]i in a representative cell. The lower tracing shows a time course in a representative cell in a Ca2+ free solution (containing 1 mM EGTA). Arrows indicate when nC60 (final conc. 10 μg/mL) was added. There was no response observed when the nC60 vehicle was added (not shown). (D) A dose-response curves for the effect of nC60 on Δ[Ca2+]i and the percentage of cells responded. Mean values of 30 cells ± SD are shown.](/cms/asset/77ff7368-e9d7-4074-a7b3-94daf7958be4/dijn_a_1680_f0005_b.jpg)