Figures & data
Figure 1 Schematic of QD-PA synthesis and subsequent cleavage.
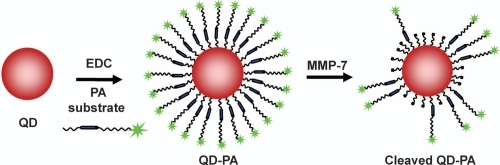
Figure 2 Gel electrophoresis confirms cleavage of the soluble, unconjugated PA construct by MMP-7. Lanes 1 and 2 show the unconjugated PA construct prior to enzymatic exposure as a control. The bright, low mobility band (identified by the white arrow) represents the intact high molecular weight PA structure. Lanes 3 and 4 represent the PA construct exposed to MMP-7 for 24 hours, while lanes 5 and 6 show the inhibition of MMP-7 activity by EDTA.
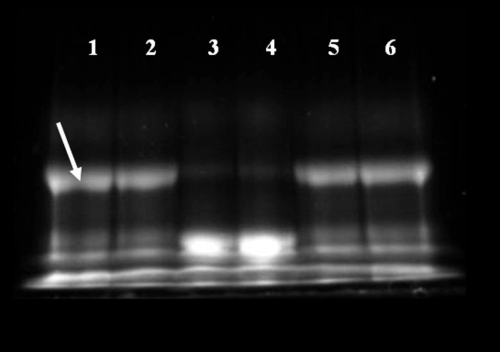
Figure 3 The surface of carboxylate QDs was successfully functionalized with the cleavable PA construct. Mobility of QDs modified with the cleavable PA construct (lane 4, diffuse band) is reduced compared with that of unmodified QDs (lane 3). 24 h exposure of the QD-PA conjugates to MMP-7 (lane 5) leads to a partial recovery of mobility, Increased mobility after exposure to MMP-7 can be completely inhibited by the addition of 30 mM EDTA (lane 6). This image is representative of three independent trials.
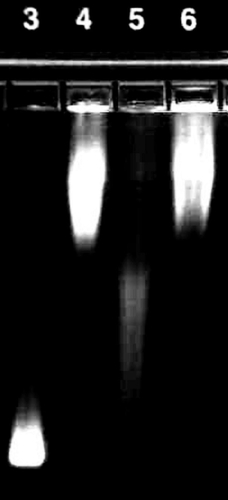
Figure 4 QDs modified with PA construct possess two fluorescence emission peaks consistent with colocalized QD and PA construct fluorescence. Exposure to MMP-7 (dashed line) results in reduced 5-FAM fluorescence intensity at approximately 520 nm when compared to control, uncleaved QD-PA samples (solid line). Results shown are representative of n ≥ 3 trials for all experimental groups.
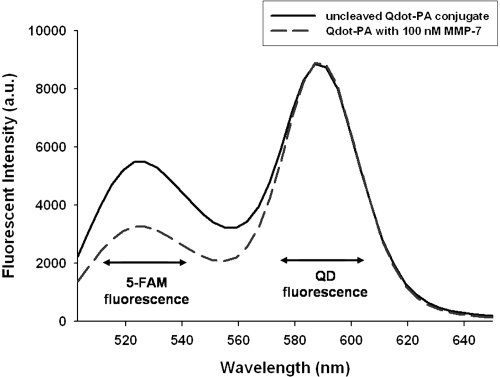
Figure 5 Fluorescence spectra of control, uncleaved QD-PA structures were compared to those of samples incubated with variable concentrations of MMP-7. Statistical measurements: * = p < 0.05, **p < 0.001. n ≥ 3 for all concentrations and timepoints.
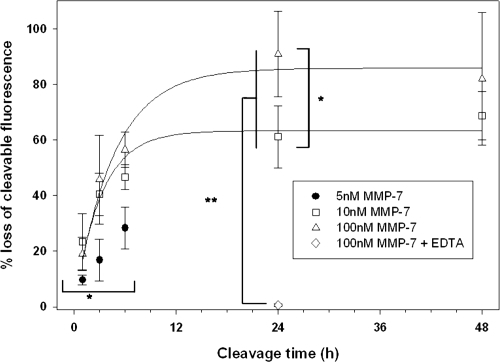
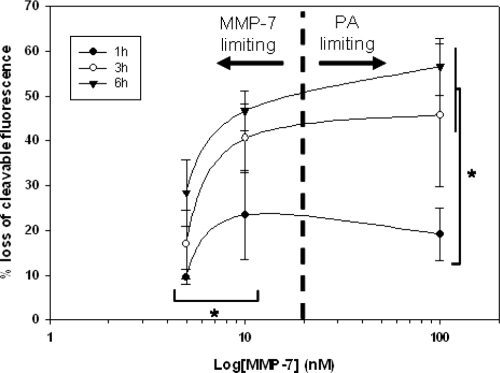
Figure 6 Cleavage of PA construct from the QD surface at early timepoints (t < 6 h) is modulated by MMP-7 concentration. Quantitative cleavage measurements were analyzed in the form of a dose response curve to highlight the influence of enzyme concentration on construct cleavage. * = p < 0.05, n ≥ 3 for all MMP-7 concentrations and timepoints.