Figures & data
Figure 1 Morphological similarities of published TEM images of spherical, apatite-containing formations in renal papillae (A and B) and CNP (C and D). Magnifications: A, 20,000X; B, 30,000X; C and D, bars 200 nm. Reprinted from A: Coe FL, Evan A, Worcester E. 2005. Kidney stone disease. J Clin Invest, 115:2598–2608, with permission from American Urological Association. B: Matlaga BR, Coe FL, Evan AP, et al 2007. The role of Randall’s plaques in the pathogenesis of calcium stones. J Urol, 177:31–38, with permission from American Urological Association. C: Kajander EO, Ciftcioglu N. 1998. Nanobacteria: an alternative mechanism for pathogenic intra- and extracellular calcification and stone formation. Proc Natl Acad Sci USA, 95:8274–8279, with permission from National Academy of Sciences USA. D: Kajander EO, Ciftcioglu N, Aho K, et al 2003. Characteristics of nanobacteria and their possible role in stone formation. Urol Res, 31:47–54, with kind permission from Springer Science and Business Media.
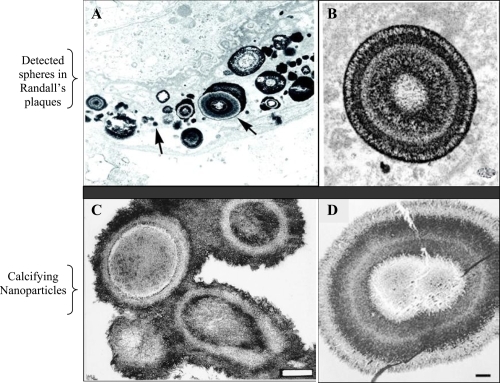
Figure 2 SEM images showing the similarity of apatite spheres in various sizes in the core of an oxalate kidney stone (A) and apatite formations in the CNP culture (B). Bars = A; 1 μm, B; 10 μm.
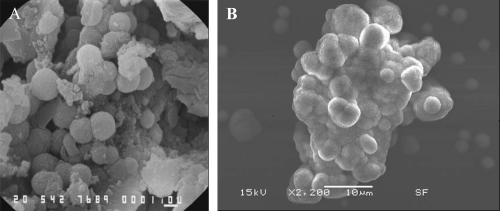
Table 1 ELISA result ratings
Table 2 Observation of Randall’s plaques on gross inspection, and the detection of CNP by various methods
Table 3 Association between the observation of Randall’s plaques and the patients’ tumor types
Figure 3 Immunohistochemical (IHS) staining of paraffin-embedded renal tissue by using anti-CNP monoclonal antibody. Brown color shown by black arrows indicates positive signal (existence of CNP antigen) in the tissue. The images shown at A (100X) and B (200X) are from renal plaque-positive, IHS-positive tissue. C (100X) and D (400X) are from IHS-negative tissue, E and F (200X) are consecutive sections from a positive tissue. E is stained by omitting the monoclonal antibody, showing no positive signal whereas F positively stained in one of the collecting ducts.
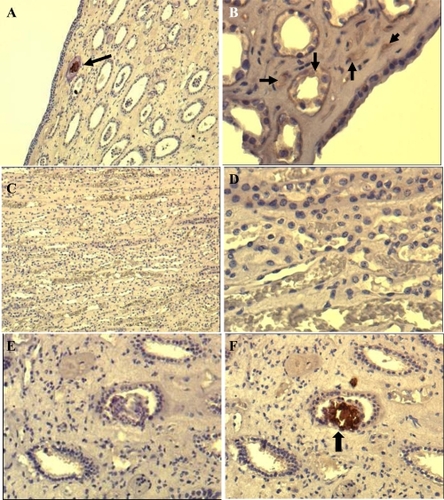
Figure 4 Light microscopic images of double staining results of patient samples cultured under CNP culture conditions. (A) IIFS of cultured patient samples showed positive fluorescence signal using monoclonal antibody 8D10 when imaged with the green bandpass emission filter, (B) Negative results of Hoechst dye of sample A imaged with the blue bandpass emission filter. (C) IIFS of negative bacterial control (nonpathogenic E. coli strain HB101) showed no fluorescence signal using CNP-specific monoclonal antibody when imaged with green bandpass emission filter. (D) Positive results of Hoechst dye of sample C imaged with the blue bandpass emission filter.
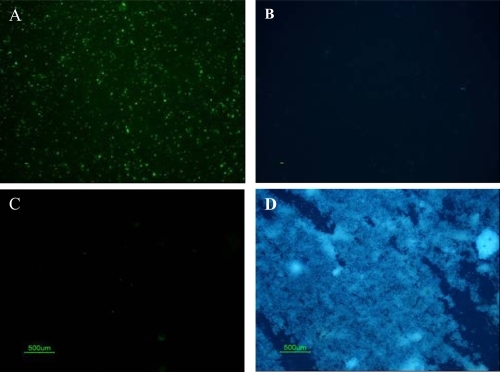
Figure 5 SEM images of (A): cultured CNPs from a serum sample, (B, C, and D): CaP spheres detected on renal papilla (Randall’s plaque). Bars; 2 μm.
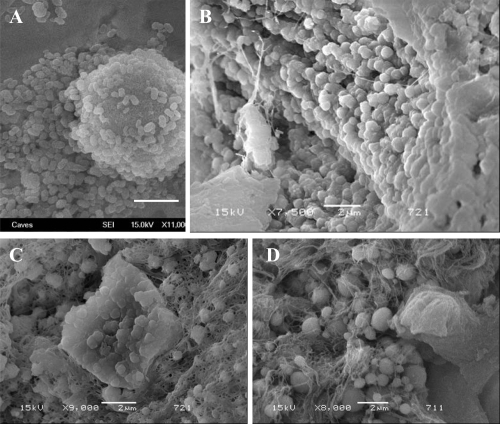
Figure 6 SEM analysis of renal papilla and EDS analysis. A, Renal cells with no plaques. B, renal cells with plaque formations showing bumpy surface. White arrows show the spherical apatite formations on renal cells. C, EDS analysis of the one representative apatite sphere on the cells shown in B.
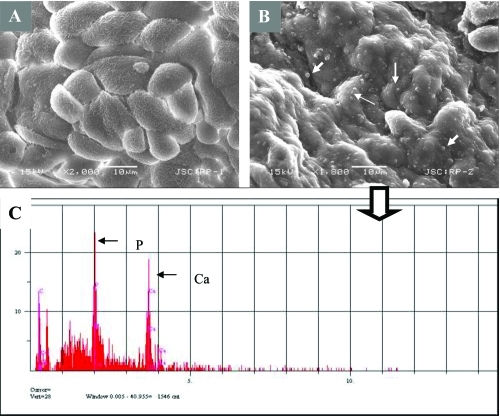
Figure 7 Images from Randall’s plaques. (A) Tiny calcifications at the tip of the renal papilla. (B) Relatively large calcified plaques. (C) A cross section through the renal papilla, showing sub-epithelial calcifications running deep into the renal medulla (approximately 3 mm). Images of renal papillary tissue with (D) and without (E) visible plaque formations. and their SEM images (F) and (G), respectively. Black arrows show streaks of plaques in the tissue, white small arrows show the apatite spheres on the tissue. Bars in F and G are 10 μm.
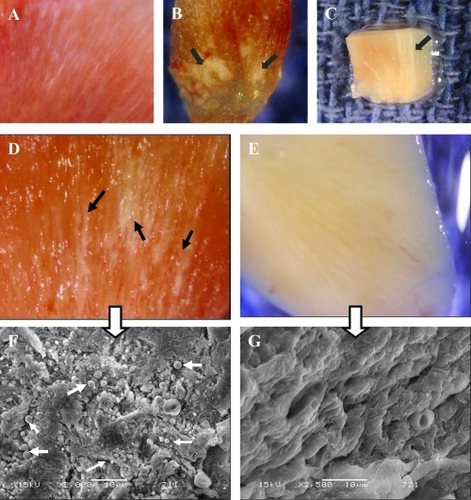
Table 4 Summary of ELISA results
Table 5 Fisher’s exact analysis of SEM/EDS test results versus CNP propagation from the papillary tissue results
Table 6 Fisher’s exact analysis of SEM/EDS test results versus ELISA-Ag test results