Figures & data
Table 1 X-ray photoelectron spectroscopy data for ZnO/PU composites. Zinc was detected at the surface for samples with weight ratios of 50:50 (PU:ZnO) wt.% and 75:25 (PU:ZnO) wt.%. No zinc was detected at the surface of samples with a lower concentration of ZnO nanoparticles
Figure 1 Scanning electron micrographs of the ZnO/PU composites. 50:50 (PU:ZnO) wt.% at 6,000X (a) and 30,000X (b); 75:25 (PU:ZnO) wt.% at 6,000X (c) and 30,000X (d); 90:10 (PU: ZnO) wt.% at 6,000X (e) and 30,000X (f); 98:2 (PU:ZnO) wt.% at 6,000X (g) and 30,000X (h); 100:0 (PU:ZnO) wt.% at 6,000X (i) and 30,000X (j).
Notes: Scale bar for images in left column = 5 μm. Scale bar for images in right column = 1 μm.
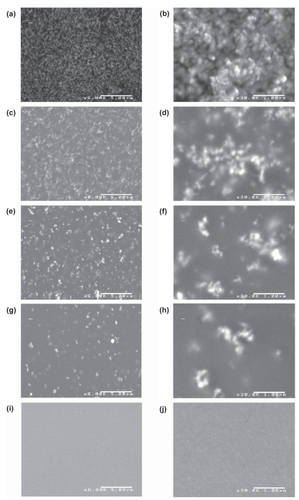
Table 2 Contact angles of three liquids on sample surfaces. Contact angle data was used to determine surface energy via the Owens-Wendt equation
Figure 2 Surface energy of ZnO/PU composites. Surface energy was calculated for each sample by measuring the contact angle of three liquids at the sample surface and entering values into the Owens-Wendt equation.
Notes: Values are mean ± SEM; n = 3; *p < 0.05 (compared to 100:0 [PU:ZnO] wt.%), **p < 0.05 (compared to 90:10 [PU:ZnO] wt.%).
![Figure 2 Surface energy of ZnO/PU composites. Surface energy was calculated for each sample by measuring the contact angle of three liquids at the sample surface and entering values into the Owens-Wendt equation.Notes: Values are mean ± SEM; n = 3; *p < 0.05 (compared to 100:0 [PU:ZnO] wt.%), **p < 0.05 (compared to 90:10 [PU:ZnO] wt.%).](/cms/asset/481d3716-c894-42d0-8be9-7abe8a1e39f0/dijn_a_4346_f0002_b.jpg)
Figure 3 Fluorescence microscope images of astrocyte adhesion after 4 h. Astrocytes were seeded at a density of 5000 cells/cm2 on each sample for 4 h. Cells seeded on glass (a), 100:0 (PU:ZnO) wt.% (b), 98:2 (PU:ZnO) wt.% (c), 90:10 (PU:ZnO) wt.% (d), 75:25 (PU:ZnO) wt.% (e), and 50:50 (PU:ZnO) wt.% (f).
Notes: Samples were stained with Calcein-AM prior to imaging. Scale bar = 200 μm.
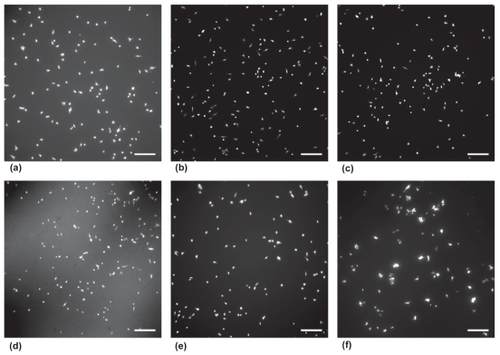
Figure 4 Results of astrocyte 4 h adhesion assay. 5000 cells/cm2 were seeded on each sample and incubated for 4 h. Cell density was determined from images taken at five random locations on each sample.
Notes: Values are mean ± SEM; n = 3; *p < 0.05 (compared to 100:0 [PU:ZnO] wt.%), **p < 0.05 (compared to 90:10 [PU:ZnO] wt.%).
![Figure 4 Results of astrocyte 4 h adhesion assay. 5000 cells/cm2 were seeded on each sample and incubated for 4 h. Cell density was determined from images taken at five random locations on each sample.Notes: Values are mean ± SEM; n = 3; *p < 0.05 (compared to 100:0 [PU:ZnO] wt.%), **p < 0.05 (compared to 90:10 [PU:ZnO] wt.%).](/cms/asset/b8c0d8d9-b6c3-4caf-a765-1d395953a1fc/dijn_a_4346_f0004_b.jpg)
Figure 5 Results of 1, 2, and 3 day astrocyte proliferation assay. Cells were seeded at t = 0 with 2500 cells/cm2. Values are mean ± SEM; n = 3; *p < 0.05 (compared to 100:0 [PU:ZnO] wt.% at the same time point), **p < 0.05 (compared to 90:10 [PU:ZnO] wt.% at the same time point), ‡p < 0.05 (compared to same sample composition at the 24 h time point), ⋄p < 0.05 (compared to same sample composition at 48 h time point).
![Figure 5 Results of 1, 2, and 3 day astrocyte proliferation assay. Cells were seeded at t = 0 with 2500 cells/cm2. Values are mean ± SEM; n = 3; *p < 0.05 (compared to 100:0 [PU:ZnO] wt.% at the same time point), **p < 0.05 (compared to 90:10 [PU:ZnO] wt.% at the same time point), ‡p < 0.05 (compared to same sample composition at the 24 h time point), ⋄p < 0.05 (compared to same sample composition at 48 h time point).](/cms/asset/20df075d-4d1c-4fe5-87e2-2a9d171f3d0e/dijn_a_4346_f0005_b.jpg)