Figures & data
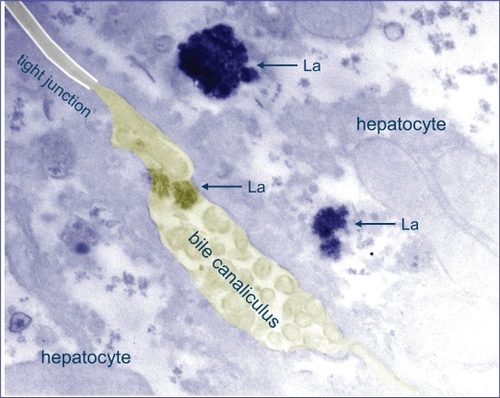
Figure 1 Comparison of the pharmacokinetics of aluminium and lanthanum. In contrast to aluminium, there is no increased deposition of lanthanum in CKD compared to patients with normal renal function, as the fraction of lanthanum absorbed in the gut is much lower, and lanthanum elimination is independent of renal function as it is mainly eliminated via the bile. Adapted with permission from Persy VP et al. Semin Dial. 2006;19(3):195–199.Citation59 Copyright © 2006 Blackwell Publishing.
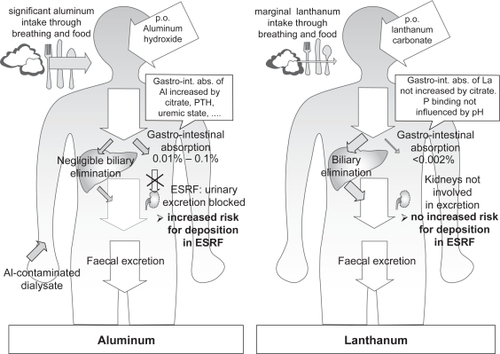
Figure 2 Schematic representation of lanthanum localization in bone. With micro X-ray fluorescence, lanthanum was found at active bone formation and resorption sites, as well as on quiescent bone surfaces and dispersed throughout the mineralized matrix. Lanthanum concentrations in proximity to resorption lacunae probably reflect lanthanum uptake in osteoclasts or macrophages.Citation58 Adapted with permission from Persy VP et al. Semin Dial. 2006;19(3):195–199.Citation59 Copyright © 2006 Blackwell Publishing.
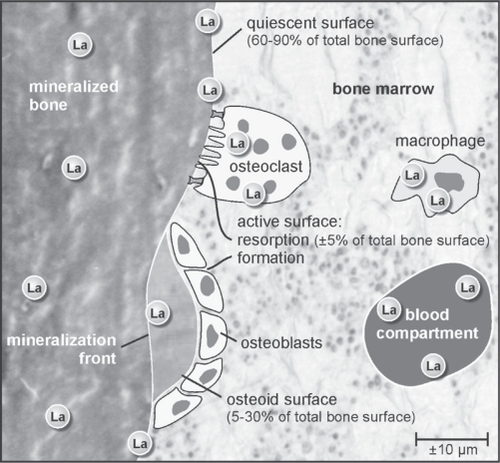
Figure 3 Lanthanum is localized in lysosomes at the biliary pole of hepatocytes. Transmission electron microscopy image of liver tissue of La loaded rat (dose: 0.3 mg/kg/day IV, 4 weeks) showing electron dense precipitates displaying a crystalline granular structure within the lysosomes and bile canaliculus. The presence of lanthanum in these granular structures was evidenced by electron energy loss spectroscopy (EELS). Adapted with permission from Macmillan Publishers, Ltd. Kidney Int. Bervoets AR, Behets GJ, Schryvers D, et al. 2009;75(4):389–398. Copyright © 2008.Citation62