Figures & data
Figure 1 The EKG of our patient showed sinus rhythm of 62/min, an abnormal left axis deviation consistent with left anterior hemiblock, Q waves in the precordial leads, and prominent ST elevation in leads V3–V5.
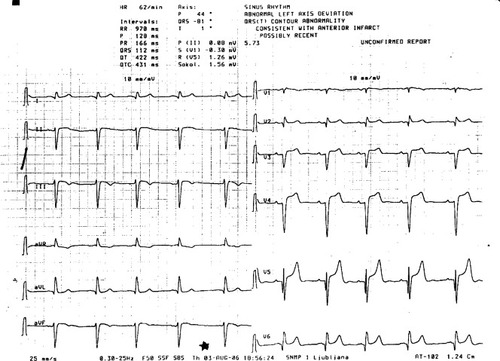
Figure 2 Chest X-ray of the patient with hypertrophic cardiomyopathy and kyphoscoliosis. Note the scoliotic curvature of the thoracic spine with the convexity on the right side and the high position of the right hemidiaphragm.
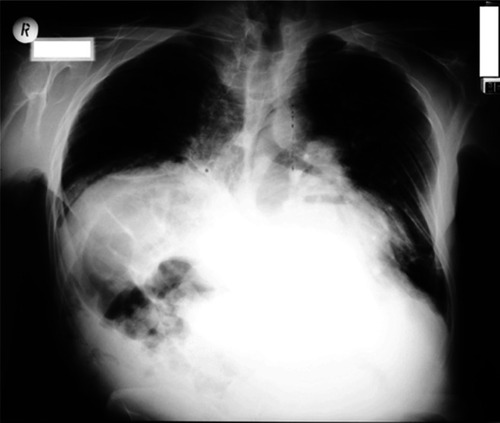
Figure 3 Magnetic resonance imaging of the heart in diastole A) and systole B) showing a severely hypertrophic interventricular septum (arrow) with a width of 3.5 cm in diastole and 3.9 cm in systole, a left ventricular-free wall of normal thickness, and a deformed chest wall with its left side running nearly parallel to the septum and free wall.
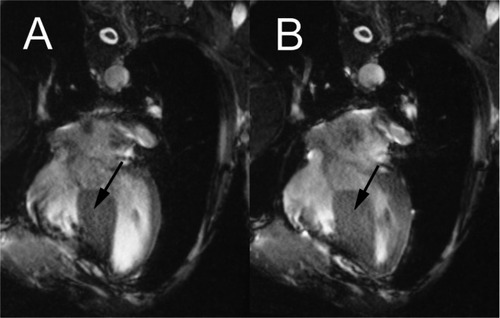
Figure 4 Myocardial perfusion imaging with 99mTc-MIBI – long horizontal axis view. No signs of ischemia or scar during dipyridamole-induced stress were noted.
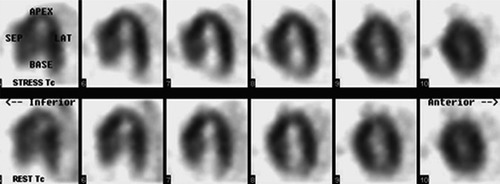
Table 1 Differential diagnosis of ST elevation in the precordial EKG leads, with specific reference to our case
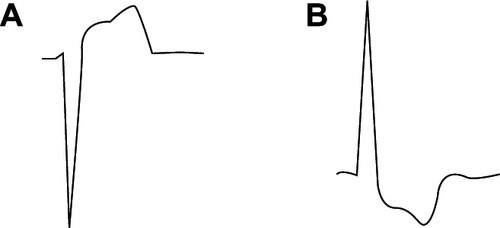
Figure 5 Our patient’s EKG reading from lead V4 A) showed a classical ventricular hypertrophy pattern when inverted by 180° B) which indicated that the anterior lead ST elevation was a reciprocal change reflecting septal hypertrophy.