Figures & data
Figure 1 OVA-specific IgE titers and bronchoalveolar lavage total cell counts. OVA-specific IgE titers were determined in individual serum samples by ELISA and results are expressed as units relative to a standard curve generated from positive control sera (arbitrary units; A). The lungs of OVA and saline-treated mice were lavaged with ice-cold PBS. Total cell counts were made by Trypan blue exclusion (B). Results are expressed as total cell number ×10−3 per mL BAL fluid retrieved. **P < 0.01, ***P < 0.001 vs respective saline control, ##P < 0.01 vs respective wildtype control.
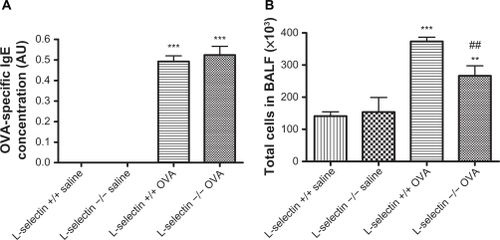
Table 1 Bronchoalveolar fluid differential cell counts
Figure 2 Morphometric analysis of airway wall remodeling changes. Serial sections of paraffin-embedded lung tissues stained with H&E, Masson’s trichrome, and AB-PAS were analyzed using Image Pro-Discovery software (Media Cybernetics, San Diego, California) for thickness of the epithelial (A), subepithelial collagen (B), smooth muscle layer (C), and number of goblet cells (D). ***P < 0.001 vs respective saline control, #P < 0.05, ##P < 0.01, ###P < 0.001 vs respective wildtype control.
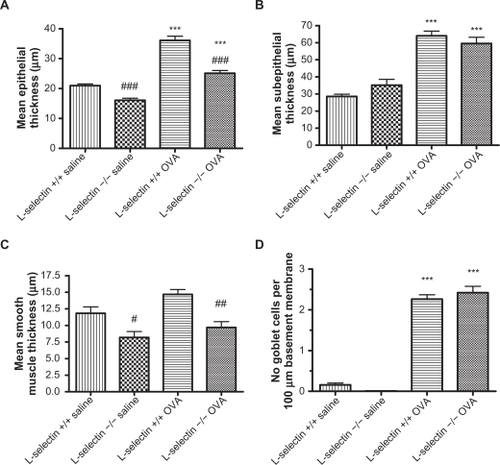
Figure 3 Representative photomicrographs of mouse lung stained with Masson’s trichrome. L-selectin +/+ saline (A), L-selectin −/− saline (B), L-selectin +/+ OVA, L-selectin −/− OVA. Bar = 100 μm.
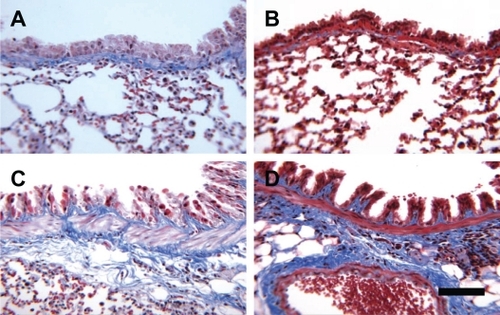
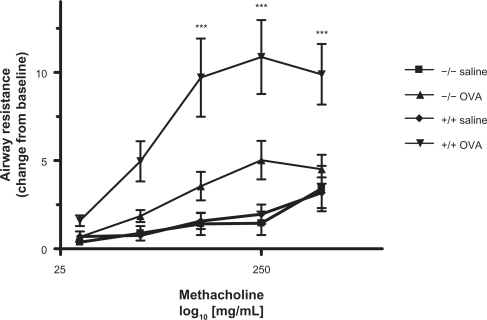
Figure 4 Airway hyperresponsiveness. Methacholine-induced AHR was measured by plethysmography 24 h after the final aerosol challenge. Results are presented as +/− standard deviation and expressed as the resistance change from baseline (PBS only) responses of individual mice. Two-way ANOVA with Bonferroni post-test was used to compare groups. **P < 0.01, ***P < 0.001 vs respective saline control, ###P < 0.001 vs respective wildtype control.