Figures & data
Figure 1 Appearance of contact exposure reaction in an allergic asthmatic patient to the larvae of the sycamore tussock moth, Halysidota harrisii Walsh, 1864. Inflammation and induration are evident in the anticubital fossa (site of catapillar exposure) with proximal and distal radiation.
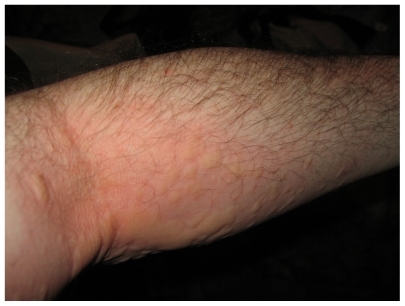
Figure 2 Picture of the larvae of the sycamore tussock moth, Halysidota harrisii Walsh, 1864.
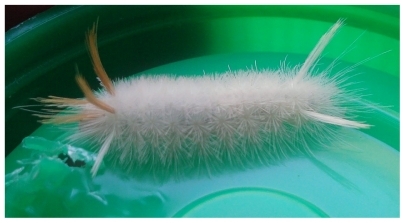
Table 1 Immunoglobulin levels in serum of a patient with an allergic response to caterpillar exposure
Table 2 Distributions of lymphocyte subpopulations in peripheral blood of a patient with an allergic response to caterpillar hair
Table 3 Distributions of lymphocyte subpopulations in peripheral blood of a patient with an allergic response to caterpillar exposure
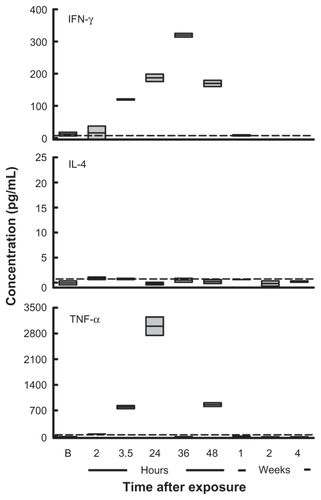
Figure 3 Serum levels (pg/mL) of cytokines (IFN-γ, IL-4, TNF-α) determined by ELISA in patient after immune response to caterpillar exposure (2–48 hrs, 1–4 weeks post exposure). Dashed line indicates the assay detection threshold based on calibration curves.