Figures & data
Figure 1 Levels of GATA-3 specific mRNA in PBMC was lower in children with β-cell autoantibodies (Aab+) than control children (Control) and children with HLA risk genotype (HLA risk). Two children with autoantibodies but without HLA risk genotype are marked with arrows. Horizontal lines indicate median values and p-values of Mann-Whitney U-test are shown in the figure.
Abbreviations: HLA, human leukocyte antigen; PBMC, peripheral blood mononuclear cells.
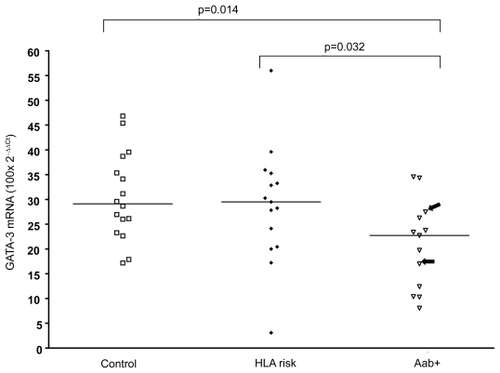
Figure 2 Relative expression level of specific mRNA in PBMC from children with T1D at different duration and in healthy control children. The levels of IL-12Rβ1 mRNA (a) (type 1 marker), IL-4Rα mRNA (b) (type 2 marker) was lower at all time points, and T-bet mRNA (c) (type 1 marker) was decreased at diagnosis and after 12 month. Horizontal lines indicate median values and p-values of Mann-Whitney U-test are shown in the figure.
Abbreviations: HLA, human leukocyte antigen; PBMC, peripheral blood mononuclear cells; T1D, type 1 diabetes.
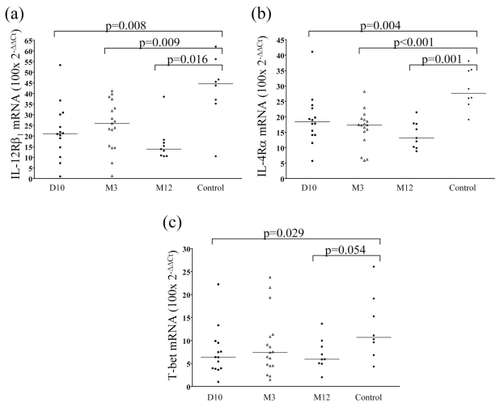
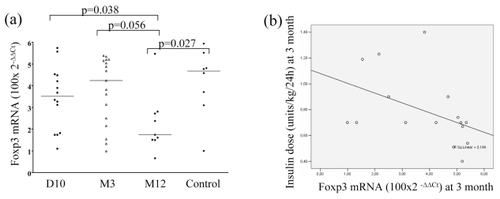
Figure 3 (a) Foxp3 mRNA expression (Treg marker) was lower after 12 month (M12) after diagnosis than earlier during the follow-up in children with T1D, and also when compared to healthy controls. (b) Relative expression level of Foxp3 mRNA shows a negative correlation with insulin dose (units/kg/24 h) at 3 months (R = −0.541; p = 0.03).