Figures & data
Figure 1 Effects of local anesthetics on DPPC liposomal membranes at different pH. Lidocaine (0.2%, w/v), prilocaine (0.2%, w/v) and bupivacaine (0.05%, w/v) were reacted with DPPC liposomes for 15 min at 37 ºC at pH 7.4 and 6.4, followed by DPH fluorescence polarization measurements. Each result represents mean ± SE (N = 6–8). **p <0.01, compared with pH 7.4.
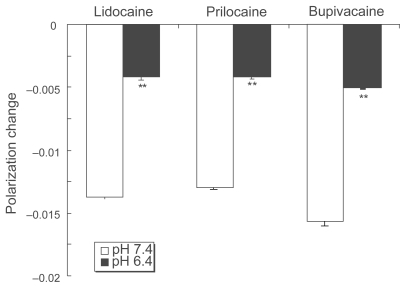
Figure 2 Effects of local anesthetics on nerve cell membranes at different pH. Lidocaine (0.2%, w/v), prilocaine (0.2%, w/v) and bupivacaine (0.05%, w/v) were reacted with nerve cell model membranes for 15 min at 37 ºC at pH 7.4 and 6.4, followed by DPH fluorescence polarization measurements. Each result represents mean ± SE (N = 6–8). **p <0.01, compared with pH 7.4.
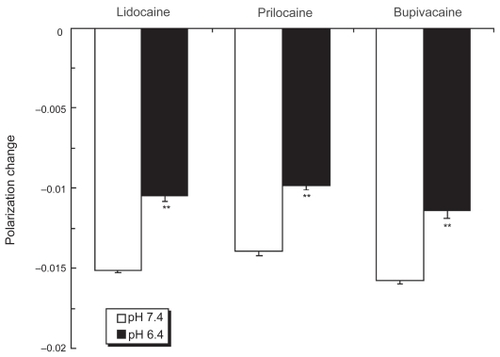
Figure 3 Effects of local anesthetics on liposomal membranes consisting of different phospholipids. Lidocaine (0.2%, w/v), prilocaine (0.2%, w/v) and bupivacaine (0.05%, w/v) were reacted with POPC, POPE, SM or POPS liposomes for 15 min at 37 ºC at pH 7.4 and 6.4, followed by DPH fluorescence polarization measurements. Each result represents mean ± SE (N = 6–8). **p <0.01, compared with pH 7.4.
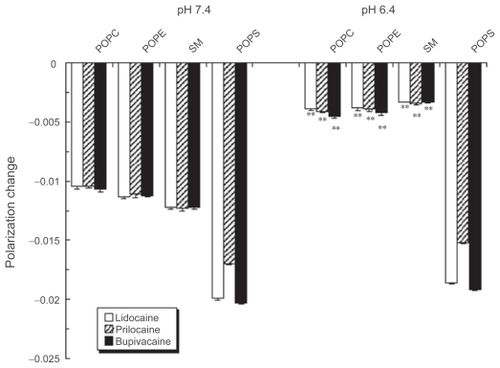
Table 1 Relative concentrations of uncharged anesthetic molecules calculated by the Henderson-Hasselbalch equation and relative potencies to interact with different liposomal membranes (mean ± SE, N = 6–8)
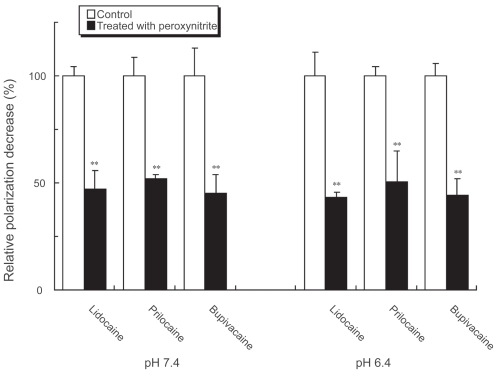
Figure 4 Influence of peroxynitrite on local anesthetic membrane effects. Lidocaine (0.2%, w/v), prilocaine (0.2%, w/v) and bupivacaine (0.05%, w/v) were treated with 50 μM peroxynitrite for 5 sec at pH 7.4 and 6.4. Their effects on nerve cell model membranes were determined after reaction for 15 min at 37 ºC by measuring DPH fluorescence polarization. Each result represents mean ± SE (N = 6–8). **p < 0.01, compared with control (not treated with peroxynitrite).