Figures & data
Figure 1 Secretion of CX3CL1 from OBs and the effects of TNF-α and IFN-γ. Cultured OBs from RA patients (A) or MG63 cells (B) were incubated for 24 h with the indicated doses of TNF-α and/or IFN-γ. (C) RA OBs stimulated with cytokines were collected after 2, 4, 8, and 24 h of stimulation. (D) RA OBs stimulated with cytokines were treated with either GM-6001 or negative control compound for 24 h. CX3CL1 levels in culture supernatants and cell lysates were assayed using specific ELISAs. Data are expressed as the means ± SEM of 5 independent experiments. *p < 0.01 vs control medium; **p < 0.05 vs control medium.
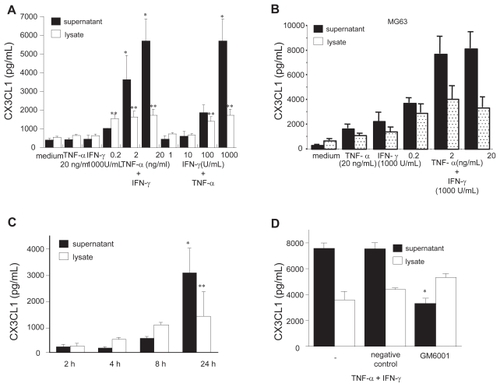
Figure 2 Cell surface expression and mRNA expression of CX3CL1 in RA OBs. (A) Representative photomicrographs showing the immunohistochemical localization of antigenic CX3CL1 in RA OBs stimulated with TNF-α (20 ng/mL) and IFN-γ (1000 U/mL) for 24 h (original magnification, 400×). (B) Flow cytometric analysis of the level of CXC3L1 expression. Cultured OBs from RA patients were incubated for 24 h with TNF-α (20 ng/mL) and IFN-γ (1000 U/mL). (C) Real-time RT-PCR analysis of CX3CL1 mRNA expression in RA OBs. Cultured OBs from RA patients were incubated for 4 h with TNF-α (20 ng/mL) and IFN-γ (1000 U/mL). Data are means ± SEM of 3 independent experiments. *p < 0.05 vs control medium. (D) Representative agarose gel analysis of CX3CL1 semiquantitative RT-PCR products.
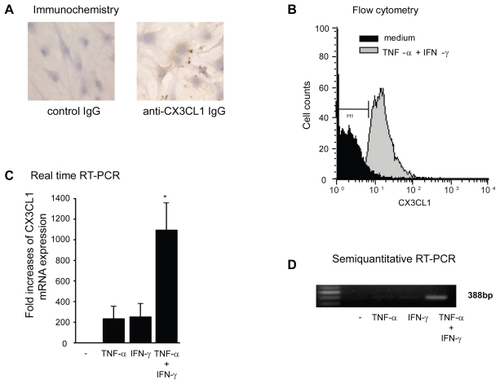
Figure 3 Secretion (A) and mRNA expression (B) of CX3CL1 by OBs from RA, OA, or normal controls. OBs from RA patients (n = 3), OA patients (n = 2), or normal individuals (n = 2) were incubated for 24 h or 4 h with TNF-α (20 ng/mL) and IFN-γ (1000 U/mL). CX3CL1 levels in the culture supernatants (A) and CX3CL1 mRNA expression (B) were assayed using specific ELISAs and real-time PCR, respectively. Data are expressed as the means ± SEM of 3 to 5 independent experiments. *p < 0.05 vs control OBs, **p < 0.05 vs control OBs and OA OBs.
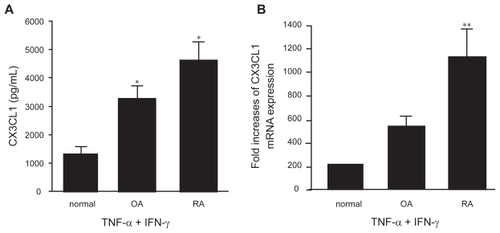
Figure 4 NF-κB expression in OBs and its role in the induction of CX3CL1 expression. (A) Real-time RT-PCR analysis revealed enhanced expression of NF-κB mRNA in RA OBs incubated for 4 h with TNF-α (20 ng/mL) plus IFN-γ (1000 U/mL). (B and C) Effects of NF-κB-specific siRNA on CX3CL1 secretion and mRNA expression. RA OBs transfected with either NF-κB-specific siRNA or negative control siRNA were incubated for 24 h (B) or 4 h (C) with TNF-α (20 ng/mL) plus IFN-γ (1000 U/mL), after which culture supernatants (B) or total RNA (C) were isolated and ELISA or real-time PCR for CX3CL1 were conducted. Data are means ± SEM from 3 independent experiments. *p < 0.05 vs medium alone (A), *p < 0.05 vs TNF-α/IFN-γ with control siRNA (B and C).
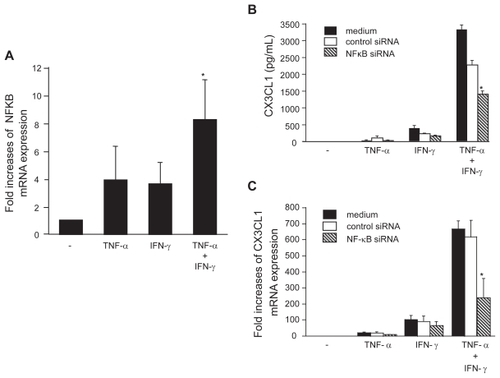
Figure 5 Effect of pyrrolidine, an NF-κB inhibitor, on CX3CL1 expression by OBs. RA OBs stimulated with TNF-α/IFN-γ were incubated with graded doses of the NF-κB inhibitor pyrrolidine, after which culture supernatants (A) or total RNA (B) was isolated and ELISA or real-time PCR for CX3CL1 were conducted. Data are means ± SEM from three independent experiments. *p < 0.05 vs TNF-α/IFN-γ.
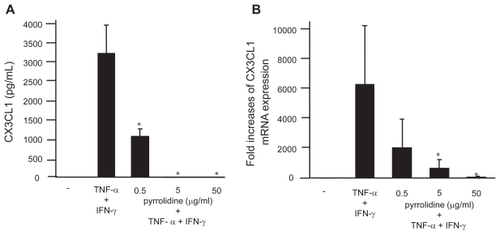
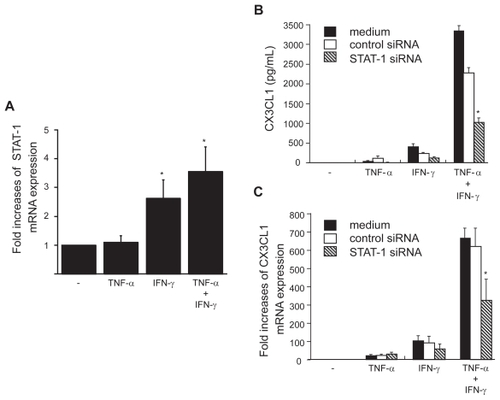
Figure 6 STAT-1 expression in OBs and its role in the induction of CX3CL1 expression. (A) Real-time RT-PCR analysis revealed enhanced expression of STAT-1 mRNA in RA OBs incubated for 4 h with TNF-α (20 ng/mL) plus IFN-γ (1000 U/mL) and in RA OBs incubated with IFN-γ alone. (B and C) Effects of STAT-1-specific siRNA on CX3CL1 secretion and expression. RA OBs transfected with either STAT-1-specific siRNA or negative control siRNA were incubated for 24 h (B) or 4 h (C) with TNF-α (20 ng/mL) plus IFN-γ (1000 U/mL), after which culture supernatants (B) or total RNA (C) was isolated and ELISA or real-time PCR for CX3CL1 was conducted. Data are means ± SEM from three independent experiments. *p < 0.05 vs medium alone (A), *p < 0.05 vs TNF-α/IFN-γ with control siRNA (B and C).