Figures & data
Figure 1 Schematic of single-region simulation model.
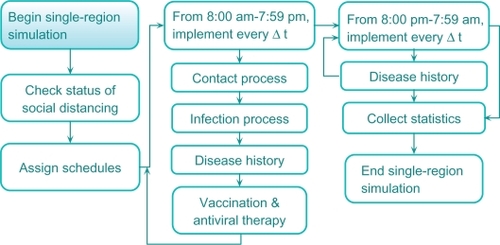
Figure 2 Schematic of disease natural history model.
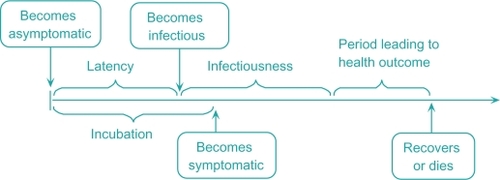
Table 1 Inter-regional travel probabilities
Table 2 Instantaneous infection probabilities
Table 3 Mortality probabilities for different age groups
Table 4 Regional resource and budget requirements
Table 5 Values of pandemic impact measures (societal and economic costs)
Figure 3 Sensitivity analysis on total resource availability (measured in terms of the average number of infected (a) and the average number of deaths (b)).
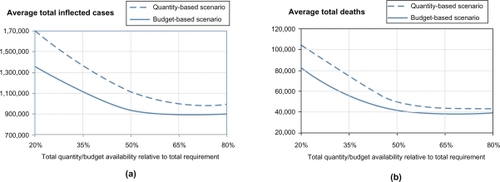
Figure 4 Sensitivity analysis on total resource availability (measured in terms of the total cost).
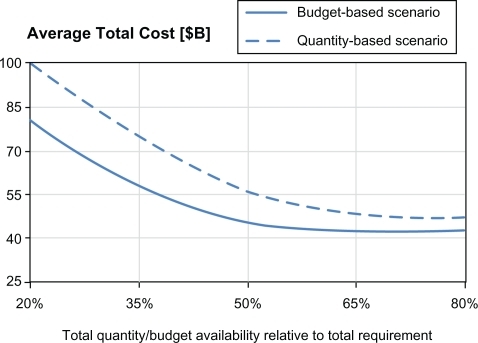
Table 6 Average number of regional outbreaks for both models