Figures & data
Table 1 Patient (wound) demographics
Figure 1 Bayesian belief network of outcomes in war wounded, excluding biomarker data. The network demonstrates the hierarchical structure of the conditional dependence relationships between clinical parameter study variables.
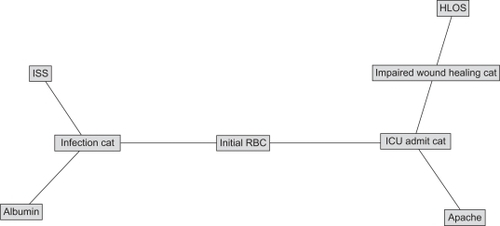
Figure 2 Bayesian belief network of outcomes in war wounded, including biomarker data.
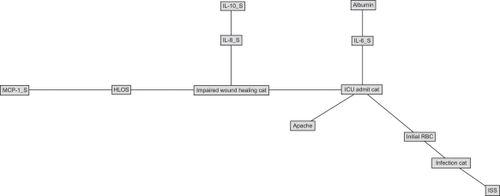
Figure 3 Estimate of infectious morbidity outcome derived from prior knowledge of initial transfusion requirement and ISS. Likelihood of infection is 7% with evidence of no prior blood product transfusion and lowest ISS category (ISS ≤ 9). In addition, no initial transfusion requirement also results in a relatively low likelihood of ICU admission (13%).
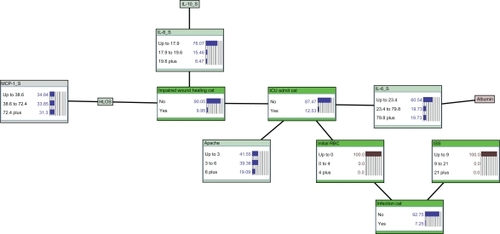
Figure 4 Estimate of infectious morbidity and ICU care outcome derived from prior knowledge of initial transfusion requirement and ISS. Likelihood of infection is 58% based on initial transfusion of 4 or more units of PRBCs and lowest ISS category (ISS ≤ 9). Likelihood of ICU admission increases to 71%.
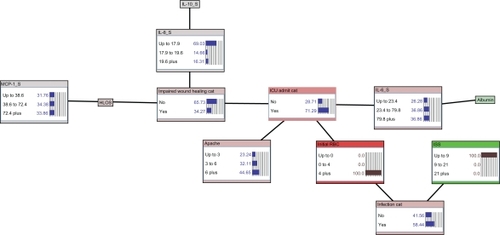
Figure 5 Estimate of infectious morbidity, ICU care, and wound healing outcome derived from prior knowledge of initial transfusion requirement, ISS, APACHE II score, and serum concentrations of IL-6, IL-8, and MCP-1. Adding prior knowledge of an APACHE II of less than 3, IL-6 concentration of 23.4 to 79.8, MCP-1 concentration of less than 38.6, and IL-8 concentration of greater than 19.6 leaves the posterior estimate of infection unchanged at 58%, while increasing likelihood of ICU admission to 83%, and yielding a likelihood of impaired wound healing of 70%.
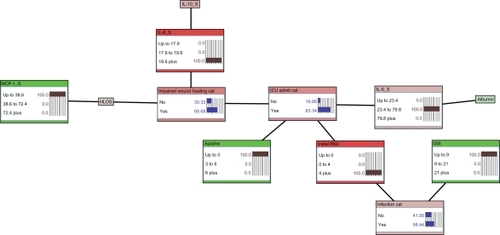
Table 2 Summary of 10-fold intra-set cross-validation exercises describing area-under-the-curve, sensitivity, specificity, accuracy, negative, and positive predictive values for key study outcomes. The first two column groups describe the performance of each of the BBN and LR models, with and without biomarkers. The BBN Lift column group describes the lift, in points, of the BBN model compared to the LR model in each test category, both excluding and including biomarkers, while the Biomarker Lift column group describes the lift of adding biomarker data to both the LR and BBN models. Degradations in performance are described in parentheses
Table 3 Inference table calculated using the Bayesian model developed in this study for selected cases of ICU admission, serum MCP-1, and IL-8 concentrations