Figures & data
Figure 1 Typical load-displacement and stress–strain diagrams with the related strain energy densities of vertebrae. A) load-displacement diagrams with linearization. B) linearized stress–strain diagrams with absorbed and recovered energy densities, the latter calculated at ultimate strains and proportional stresses.
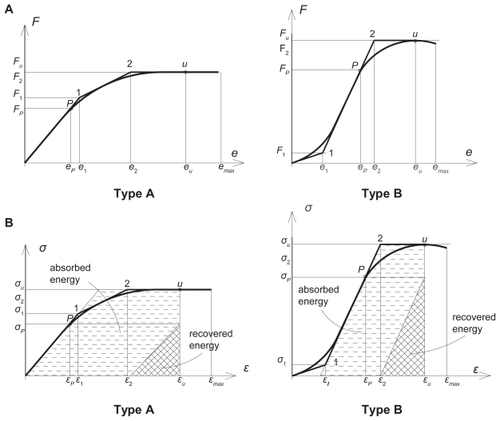
Table 1 Comparing age, density, geometry, and strength data of vertebrae L1–L2
Table 2 Age, density and geometry of vertebrae L1–L2 with age-correlation by distinguishing the sexes
Table 3 Proportional and ultimate loads and stresses with Young’s moduli of lumbar vertebrae L1–L2 correlation with age and BMD by distinguishing the sexes
Table 4 Strains, ductility, recoverable, and absorbed energy densities of lumbar vertebrae L1–L2 correlation with age and bone mineral density by distinguishing the sexes
Figure 2 Regional cross sectional areas versus aging and sex. A) Regional CSAs. B) Superior CSA vs aging and sex. C) Yearly increase of regional CSAs vs sex. D)Total increase of regional CSAs vs sex.
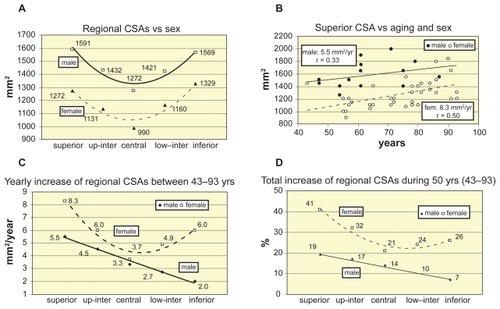
Figure 3 Decrease of ultimate load and load/volume of vertebrae L1–L2 vs aging and sex. A) Decrease of ultimate load vs aging and sex. B) Decrease of ultimate load/volume vs aging and sex.
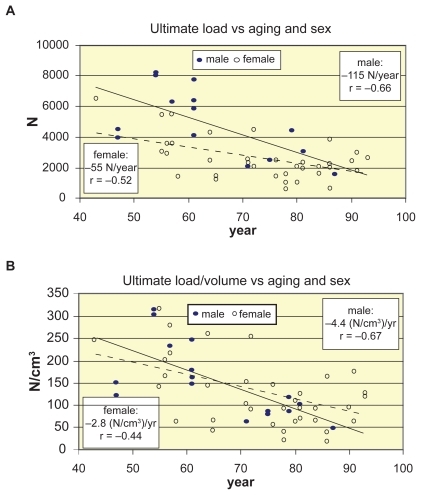
Figure 4 Decrease of regional ultimate stresses of vertebrae L1–L2 vs aging and sex. A) Decrease of central ultimate stresses vs aging and sex. B) Yearly decrease trends of regional ultimate stresses vs aging and sex. C)Total decrease % of regional ultimate stresses during 50 years between 43–93 years.
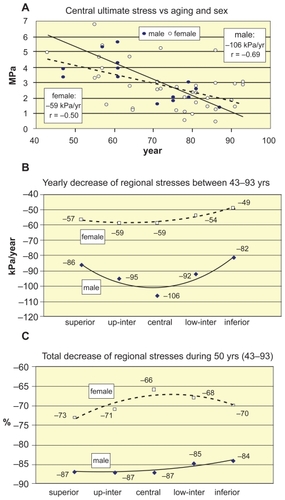
Figure 5 Decrease of Young’s modulus and ultimate stiffness of vertebrae L1–L2 vs aging and sex. A) Decrease of Young’s modulus vs aging and sex. B) Decrease of ultimate stiffness vs aging and sex.
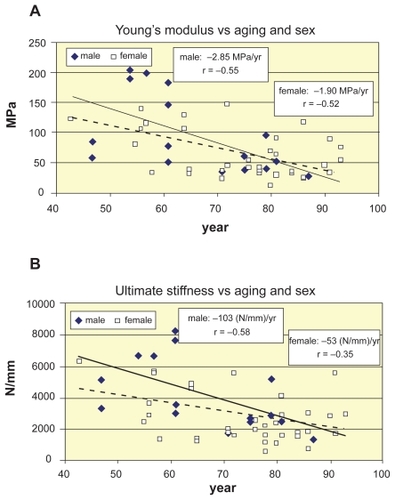
Figure 6 Age- and sex-related decrease of energy absorption capacity of vertebrae L1–L2. A, B) Age-related decline of superior ultimate and ductile energy density absorption versus sexes. C) Yearly loss of regional ultimate and ductile energy absorption capacity. D) Total regional loss of ultimate and ductile energy absorption capacity of sexes during 50 years between 43–93 years.
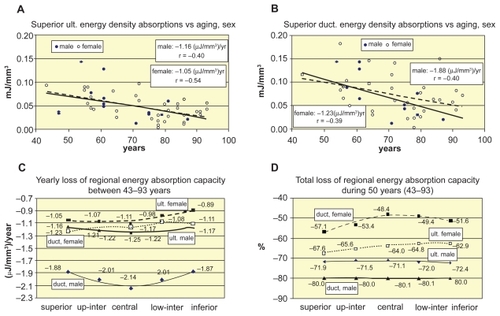
Figure 7 Compressive strength versus BMD. A, B, C, D) Increase of ultimate load, central ultimate stress, Young’s modulus, and ultimate stiffness vs BMD, respectively. Abbreviation: BMD, bone mineral density.
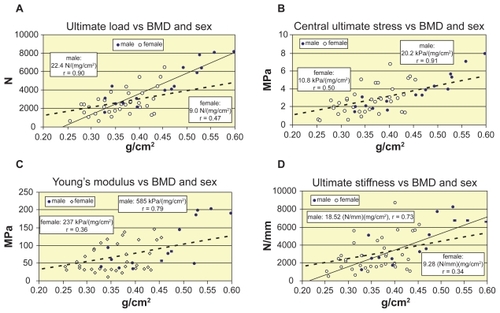
Figure 8 Bone mineral density (BMD) versus aging and sex. A) linear decline of BMD with aging and sex. B) quadratic approximation for women with yearly decline trends at age 50 and 70 years.
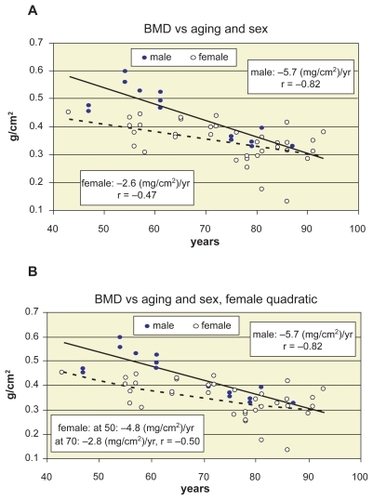
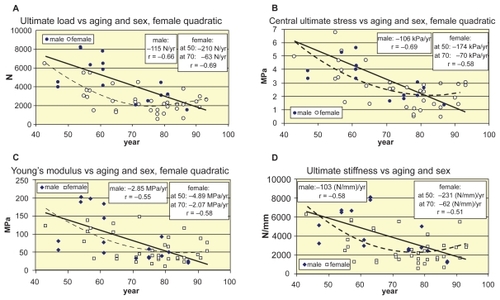
Figure 9 Age-related nonlinear approximation of strength parameters for women. A, B, C, D) Quadratic approximation of age-related decline function of ultimate load, central ultimate stress, Young’s modulus, and ultimate stiffness of women, respectively.