Figures & data
Figure 1 Flow chart showing the number of interventions and controls at time of inclusion and follow-up periods and the inclusion and exclusion criteria.
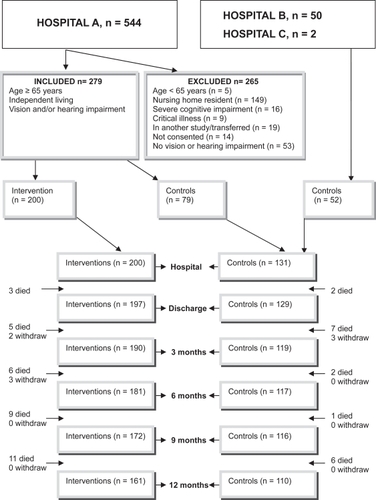
Table 1 Characteristics of participants at baseline given as number of cases (%), unless otherwise stated, with P values for group differences
Table 2 Self-reported characteristics of participants at baseline given as number of cases (%), unless otherwise stated, with P values for group differences
Table 3 Outcomes given as number of cases (%), unless otherwise stated, with odds ratio (OR) and 95% confidence interval (CI) and P values for group differences
Figure 2 Kaplan–Meier curves presenting time to first fall for the intervention group (n = 200 participants) versus the control group (n = 131 participants) controlled for by age, gender, delirium, and urine incontinence.
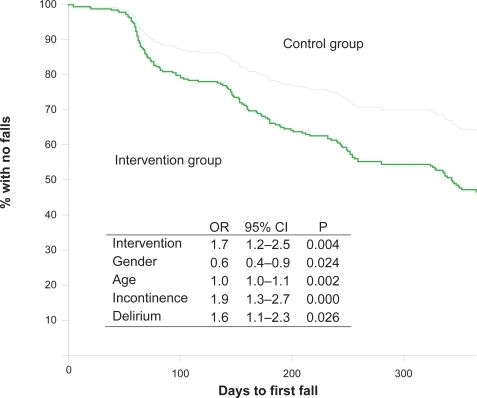
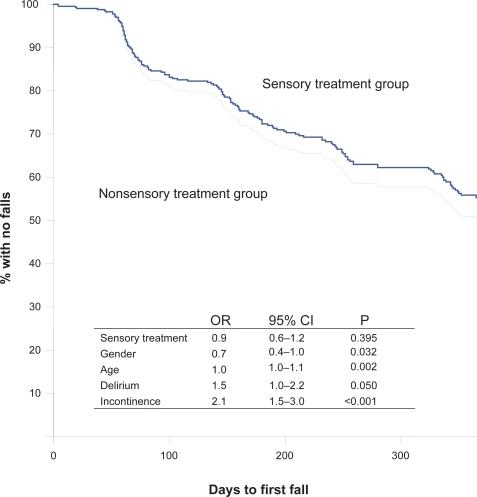
Figure 3 Kaplan–Meier curves presenting time to first fall of persons who received sensory treatment versus persons who did not, controlled for by age, gender, delirium, and urine incontinence. Sensory treatment group, n = 117; nonsensory treatment group, n = 214.