Figures & data
Figure 1A Two-stage positive screening.
Note: Black box indicates the group of participants referred for further intervention.
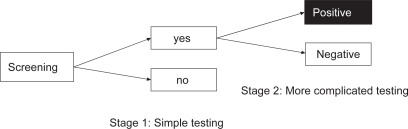
Figure 1B Two-stage negative screening.
Note: Black boxes indicate groups of participants referred for further intervention.
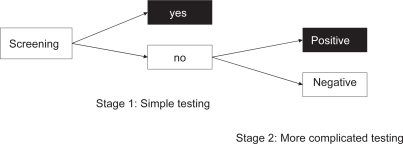
Figure 2 Two-stage window screening.
Note: Participants whose scores were in the thickened area have to be tested in the second stage.
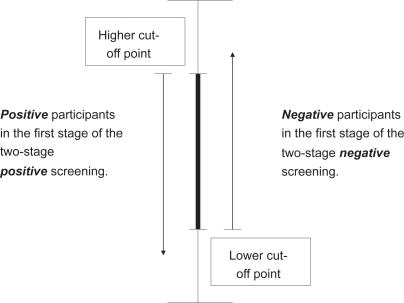
Table 1 The distribution of the WAIS-R and WCST scores, and the correlation among each subtest
Table 2 Results of multiple logistic regression analysis of the indexes of the WCST and ID
Table 3 Results of using one cut-off and two cut-off points in each group showing intellectual status (Unit: person)
Table 4 Comparison of results using two-stage positive screening and two-stage window screening