Figures & data
Figure 1 The mean Papp of mannitol across Caco-2 cell monolayers during 60 minutes’ exposure to 50 μg/ml chitosan. The numbers associated with the bars in the graph show the molecular weight of the studied chitosans in kDa. The Papp of mannitol across untreated monolayers was 2.4 ± 0.2 (×10−7) cm/sec, and is indicated in the figure by the horizontal line. Data are given as the mean of 3–4 experiments. Error bars represent standard deviations. Reprinted from CitationSchipper NG, Vårum KM, Artursson P. 1996. Chitosans as absorption enhancers for poorly absorbable drugs. 1: Influence of molecular weight and degree of acetylation on drug transport across human intestinal epithelial (Caco-2) cells. Pharm Res, 13:1686–92. Copyright © 1996, with permission from Springer Science and Business Media.
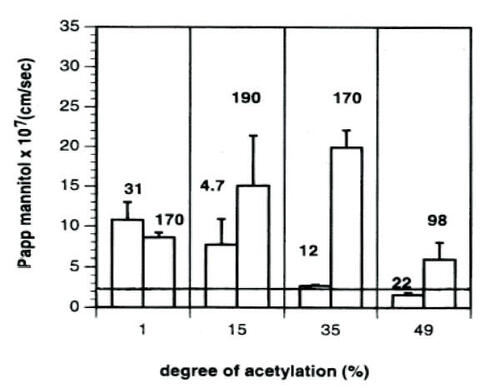
Figure 2 Serum glucose levels of streptozotocin-induced diabetic rats (mean ± SD, n = 8) after the oral administration of F5.3np at insulin doses of 50 U/kg (Δ) and 100 U/kg (▲); insulin solution at 50 U/kg (□) and 100 U/kg (■); F5.3np after cross-flow filtration, whose insulin dose was 100 U/kg before cross-flow (×). Reprinted from CitationMa Z, Lim TM, Lim L-Y. 2005. Pharmacological activity of peroral chitosan-insulin nanoparticles in diabetic rats. Int J Pharm, 293:271–80. Copyright © 2005, with permission from Elsevier.
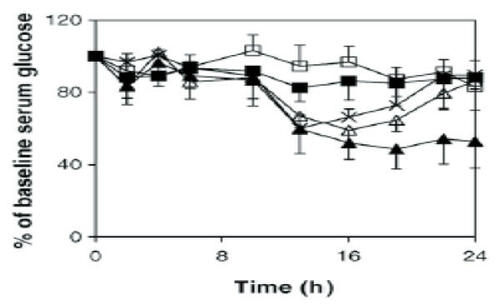
Figure 3 Ternary phase diagram of complex coacervation between pRE-luciferase plasmid and chitosan at 55°C in 50 mM Na2SO4. Sodium sulfate solution was regarded as one component, since the concentration change in the experiment range was minimal. The region to the right of line ABC depicts the conditions under which phase separation occurred. The concentration ranges in the small grid area yielded distinct particles as observed under a phase contrast microscope. Reprinted from CitationMao H-Q, Roy K, Troung-Le VL, et al. 2001. Chitosan-DNA nanoparticles as gene carriers: synthesis, characterization and transfection efficiency. J Control Release, 70:399–421. Copyright © 2001, with permission from Elsevier.
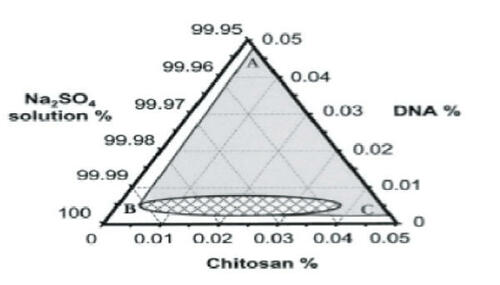
Figure 4 Anaphylactic response of mice after Arah2 challenge. Mice (n = 6) were immunized with a single dose of chitosan-pArah2 nanoparticles (single dose, G1; ◆); with 2 doses (1 week apart) of chitosan-pArah2 nanoparticles (G2; ■); with “naked” pArah2 (G3; ●); or were not immunized (G4; no symbol). Mice were then sensitized with oral and intraperitoneal doses of crude peanut extract, challenged intraperitoneally with recombinant Arah2 protein, and anaphylaxis was then scored on a scale of 0–5. Results represent average anaphylactic response from 2 separate experiments. Reprinted from CitationRoy K, Mao HQ, Huang SK, et al. 1999. Oral gene delivery with chitosan–DNA nanoparticles generates immunologic protection in a murine model of peanut allergy. Nat Med, 5:387–91. Copyright © 1999, with permission from Nature Publishing Group.
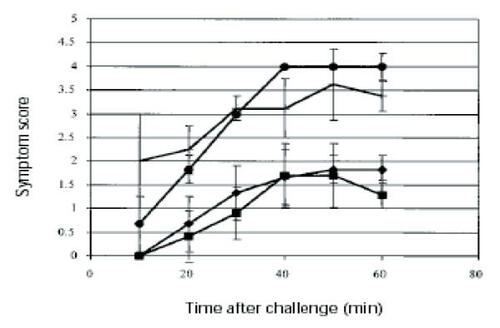
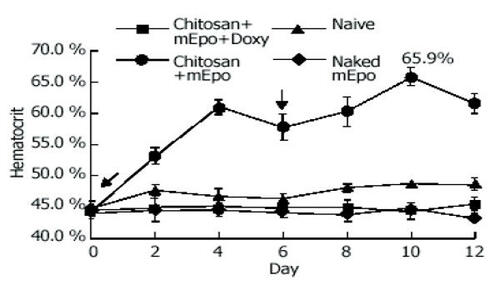
Figure 5 mEpo expression and its physiological effect test. Hematocrit was measured every 2 days in mice fed with (●) chitosan-mEPO and doxycycline (200 μg/mL), n = 9; chitosan-mEpo alone, n = 3; (◆) doxycycline (200 μg/mL) alone, n = 4; (■) naked mEpo and doxycycline (200 μg/mL), n = 5. ↓ indicates the mice fed with “naked” mEpo DNA or chitosan-Epo. Reprinted from CitationChen J, Yang WL, Li G, et al. 2004. Transfection of mEpo gene to intestinal epithelium in vivo mediated by oral delivery of chitosan-DNA nanoparticles. World J Gastroenterol, 10:112–16. Copyright © 2004, with permission from Elsevier.