Figures & data
Figure 1 Schematic illustration of chitosan–alginate core-shell nanoparticles prepared by reverse microemulsion template. Microemulsified chitosan nanoparticles were coated with Na-alginate and then crosslinked by calcium chloride solution. AOT surfactants attached on the calcium-solidified microemulsions were stripped off using acetone and water 3 times. Chitosan–alginate core-shell nanoparticles were finally collected by ultracentrifugation.
Abbreviations: AOT, sodium bis(2-ethylhexyl) sulfosuccinate; W/O, water-in-oil.
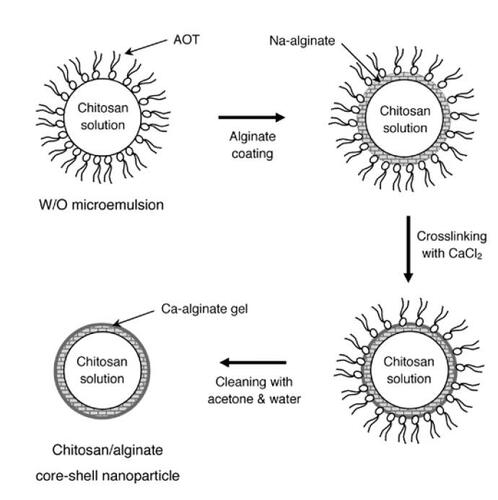
Figure 2 Phase diagram for iso-octane/chitosan solution/AOT. Point A (iso-octane/chitosan solution/AOT=97.7:0.4:1.9 by weight) located in the water-in-oil microemulsion region showed the mixture was transparent. Point B (iso-octane/chitosan solution/AOT=90.0/8.3/1.7 by weight), which sits on the line indicating the interface between the microemulsion and emulsion domains, represents the translucent appearance of the mixture. With further addition of chitosan solution, the mixture turned into a milky emulsion (point C) (isooctane/chitosan solution/AOT=81.5/16.4/2.1 by weight).
Abbreviations: AOT, sodium bis(2-ethylhexyl) sulfosuccinate.
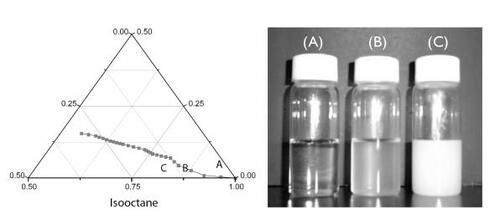
Figure 3 Confocal images of chitosan–alginate core-shell nanoparticle structure. Figure 3a shows the alginate labeled with Lucifer yellow, Figure 3b the chitosan labeled with rhodamine, and Figure 3c these images combined. Scale bar = 500 nm.
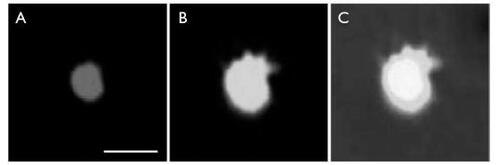
Figure 4 Particle-size distribution of chitosan.alginate nanoparticles (■) and DNA-encapsulated chitosan.alginate nanoparticles (○). Under the same preparation conditions, the mean particle sizes with and without plasmid DNA were 64.0 nm and 60.1 nm, respectively.
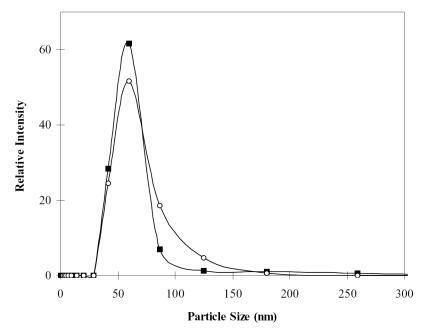
Figure 5 The affect of chitosan solution concentration on particle-size distribution. The mean diameters of N/P = 5 (∆), N/P = 10 (○), and N/P = 20 (■) were 64.0, 69.5, and 80.6 nm, respectively. The amount of DNA used was fixed at 2 μg.
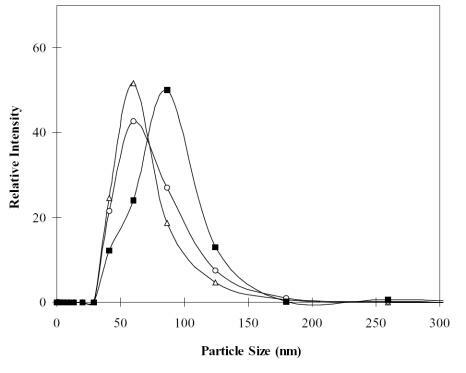
Figure 6 Photomicrographical images of NIH 3T3 cells cultured with chitosan–alginate core-shell nanoparticles at various times. Images were taken after (a) 0 hours, (b) 24 hours, and (c) 48 hours. The nanoparticles ingested into the endosomal compartments elicited the osmotic-swelling process over the period of cultivation. Arrows indicate the location of swollen vacuoles harboring chitosan–alginate core-shell nanoparticles probably undergoing erosion. N = nucleus. Scale bar = 5 μm.
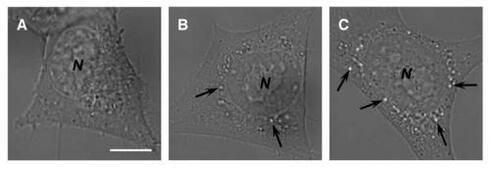
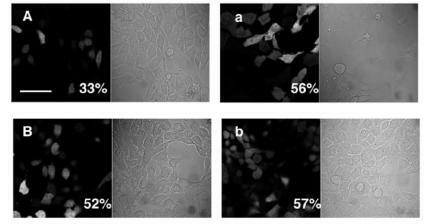
Figure 7 Photomicrographical images of NIH 3T3 cells expressing EGFP under both bright-field and fluorescent microscopy. (A) 24 hours’ transfection with DNA encapsulated in chitosan–alginate core-shell nanoparticles; (a) 24 hours’ transfection with PEI–DNA complexes; (B) 48 hours’ transfection with DNA encapsulated in chitosan–alginate core-shell nanoparticles; (b) 48 hours’ transfection with PEI–DNA complexes. These images represent one set of triplicate experimental data. Scale bar = 20 μm.
Abbreviations: EG FP, enhanced green fluorescent protein; PEI, polyethyleneimine.