Figures & data
Figure 1 (A) Schematic representation of bioaffinity quantum dot probes for biological imaging. A CdSe core is surrounded by a ZnS shell that is passivated by hydrophobic TOPO ligands and encapsulated in an amphiphilic polymer. Conjugated PEG molecules serve to reduce nonspecific adsorption, and streptavidin provides a high-affinity linker for conjugation to biotinylated proteins, nucleic acids, or other molecules. (B) Transmission electron micrograph (TEM) of water-soluble quantum dots showing an electron-dense QD core (dark) and a polymer coating as a lighter shade surrounding each QD. (C) Fluorescence micrograph showing that single QDs can be readily observed when the dots are spread on a glass cover slip.
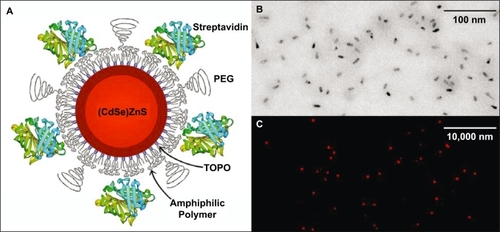
Figure 2 Fluorescence images of single quantum dots and aggregates in the cytoplasm of live fibroblast cells. (A) Single QDs observed in the cytoplasm after delivery via SLO toxin. (B) QD aggregates observed in the cytoplasm after a long period of time following SLO delivery (40 hours). Microtubules were visualized by GFP-tubulin protein expression. Both images were obtained with a spinning disk confocal microscope (Perkin Elmer), with the focal plane near the center of each cell.
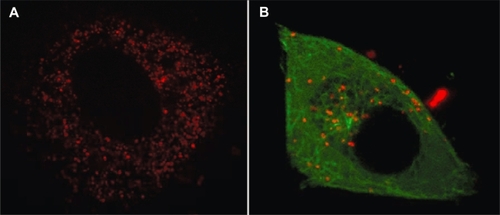
Figure 3 Color fluorescence images of human prostate cancer cells stained with multicolor QD-antibody conjugates. (a) Staining of membrane antigen E-cadherin with QD655 (emission wavelength = 655 nm); (b) staining of cytoplasmic antigen vimentin with QD525; (c) staining of nuclear antigen HIF1alpha with QD655; and (d) multiplexed staining of tumor antigens with QD525 (labeling RANKL), 565(N-cadherin), 605(EF1aplha), 655(E-cadherin) and 705 (vimentin). The cell nuclei were counterstained blue with DAPI in (a) and (b).
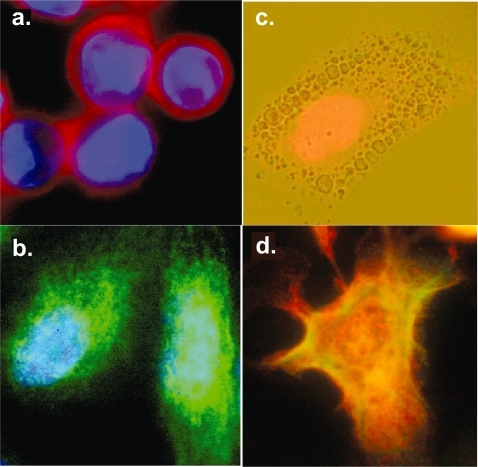
Figure 4 Multiplexed QD staining and spatial mapping of tumor antigens on single breast cancer cells. (a) Breast tumor BT-474 cell, and (b) breast tumor BT-20 cell; both were stained with cytokeratin-QD (green), Her-2-QD (yellow), epithelial specific antigen-QD (red), and the nuclear dye DAPI (blue). Control data: (c) BT-474 cancer cells treated with QDs conjugated to nonspecific bovine serum albumin, and (d) peripheral blood mononuclear cells (PBMC) treated with the same QD-antibody conjugates used in panels (a) and (b). (e) Fluorescence image of BT-474 cells labeled with FITC-conjugated antibody against cytokeratin, and (f) photobleached image after 20 seconds.
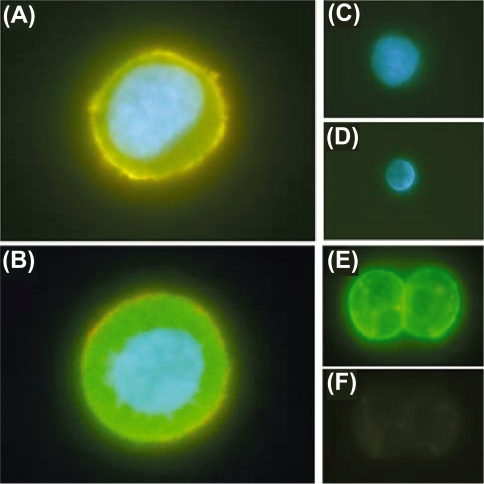
Figure 5 Multiplexed QD profiling of four tumor biomarkers using two FFPE prostate cancer cell lines with distinct bone-metastasis behaviors. The four markers, all associated with epithelial-mesenchymal transition (EMT), are N-cadherin, EF (elongation factor)-1alpha, E-cadherin, and vimentin, and their corresponding QD colors are 565 nm, 605 nm, 655 nm, and 705 nm. The cell nuclei were counterstained blue by DAPI, and the spectra were captured under blue excitation. (a) Color fluorescence image of highly metastatic prostate cancer cells (clone ARCaPm); (b) single-cell fluorescence spectrum obtained from image (a); (c) color fluorescence image of benign prostate cancer cells (clone ARCaPe); (d) single-cell spectrum obtained from image (c). The relative abundance of these markers is consistent with previous western blotting data (not shown). Note that individual cancer cells have heterogeneous expression patterns, that the single-cell data in (b) and (d) are representative of a heterogeneous cell population.
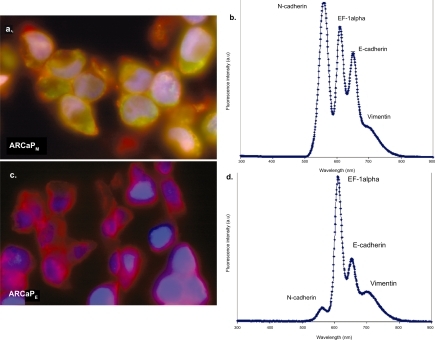
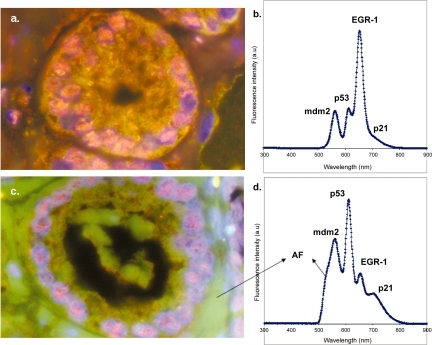
Figure 6 Multiplexed QD staining of archived FFPE clinical specimen from human prostate cancer patients, and comparison between two different glands on the same tissue specimen. Four tumor biomarkers (mdm-2, p53, EGR-1 and p21) were labeled with four colors of QDs emitting at 565 nm, 605 nm, 655nm, and 705 nm respectively. (a) Color fluorescence image of QD-stained tissue specimens showing just one gland; (b) representative fluorescence spectrum obtained from single cells in the gland (image a); (c) color fluorescence image of the same QD-stained tissue specimens but showing a different gland; (d) representative fluorescence spectrum obtained from single cells in the second gland (image c). Note that the biomarker profile is remarkably different for different glands. This ability to measure cellular heterogeneity on the same tumor specimen will be crucial for clinical applications. AF stands for autofluorescence.