Figures & data
Table 1 Size and surface charge of chitosan-DNA and PEI-DNA nanoparticles in preparation solutions and 10% bile-containing buffer
Figure 1 Chitosan-DNA nanoparticles and PEI-DNA nanoparticles afford different degrees of protection to plasmid DNA in media containing 10% and 50% bile. To characterize the protection effect by nanoparticles in the presence of bile, chitosan-DNA nanoparticles, PEI-DNA nanoparticles and naked DNA were incubated with 10% or 50% bile diluted in PBS at 37°C. The relative degree of DNA degradation was analyzed by gel electrophoresis (0.8% agarose) and stained by ethidium bromide.
Abbreviation: PEI, polyethylenimine.
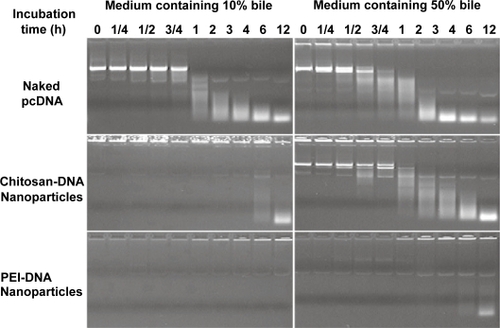
Figure 2 Bile-induced DNA damage is primarily mediated by oxidative cleavage. Plasmid DNA and chitosan-DNA nanoparticles were incubated with (A) 10% bile, (B) 10% preheated bile, (C) 10% bile with 50 mM of NAC, or (D) 10 mm H2O2solution at 37°C for 3 hours and 5 days. The relative DNA degradation was analyzed by gel electrophoresis (0.8% agarose) and stained by ethidium bromide for visualization.
Abbreviation: NAC, N-acetyl cysteine.
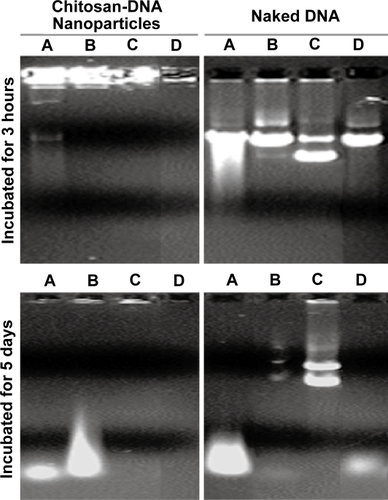
Figure 3 Transfection efficiency of PEI-DNA and chitosan-DNA nanoparticles and naked DNA in primary rat hepatocytes, Kupffer cells (KCs) and normal rat cholangiocytes (NRCs). (a). Transfection efficiency in three types of cells. Hepatocytes and KCs were transfected in 24-well dishes with the indicated complexes containing 3 μg VR1255 pcDNA for 4 hours. Luciferase expression was analyzed 48 hours after transfection. Relative light units were normalized to protein content and are the mean ± standard deviation of 2 independent experiments (n = 4). (b). Comparison of transfection efficiency in primary rat hepatocytes in the presence and absence of bile (10%). Cells were transfected in a medium containing 10% bile for 4 hours, and normal medium for 44 hours before luciferase analysis (n = 4).
Abbreviation: PEI, polyethylenimine.
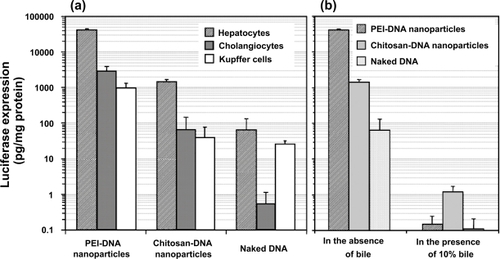
Figure 4 Luciferase expression in rat liver following RII, intraportal infusion and tail vein injection of chitosan-DNA nanoparticles, PEI-DNA nanoparticles, and naked DNA. Each bar represents mean ± standard deviation (n = 5). Chitosan C390 and VR1255 plasmid were used in this experiment. Chitosan-DNA and PEI-DNA nanoparticles were prepared at N/P ratios of 3 and 10, respectively. Nanoparticles and naked DNA were infused to rats at a dose equivalent to 200 μg of plasmid per rat (∼0.8 mg/kg of body weight) in 4 mL of medium into the common bile duct (0.1 ml/min) or portal vein (1 ml/min), or tail vein (1 mL/min). On days 3, 7, and 14, 5 rats from each group were sacrificed, and livers were harvested and homogenized in lysis buffer and analyzed for luciferase activity. Rats receiving 4 mL of PBS infusions were included as the background control that defines the detection limit for this assay at 0.04 pg luciferase/g tissue.
Abbreviation: PEI, polyethylenimine.
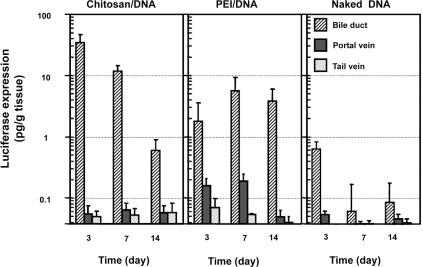
Figure 5 Luciferase expression in different lobes of the rat liver following intrabiliary injection of chitosan-DNA nanoparticles or PEI-DNA nanoparticles containing 200 μg of DNA. Each bar represents mean ± standard deviation (n = 5). Experimental condition were the same as described in .
Abbreviation: PEI, polyethylenimine.
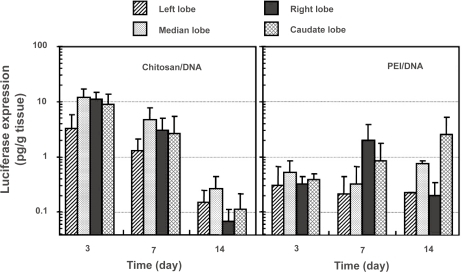
Figure 6 Luciferase expression in major organs of the rats after receiving intrabiliary injection of chitosan-DNA nanoparticles or PEI-DNA nanoparticles containing 200 μg of DNA. Each bar represents mean ± standard deviation (n = 5). Experimental conditions are the same as described in .
Abbreviation: PEI, polyethylenimine.
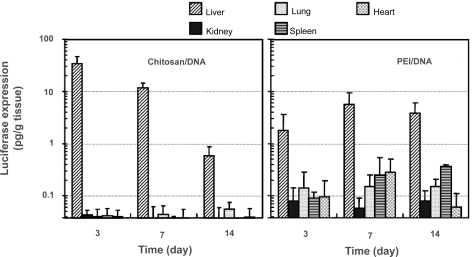
Figure 7 Confocal fluorescence images indicating DNA distribution in the right lobe of the liver that received naked DNA and nanoparticles via RII. Liver samples were collected 4 hours after intrabiliary infusion of chitosan-DNA or PEI-DNA nanoparticles containing 200 μg of Cy5 labeled DNA (pGeneGrip) or 200 μg of naked Cy5-DNA. (a–c): distribution of DNA (red); (d–h): co-localization of DNA (red) and KCs (green). KCs were stained with FITC-labeled mouse anti-rat macrophage F-6-J mAb. (i–k): co-localization of DNA (red) and endothelial cells (ECs, green). Endothelial cells were identified by immunostaining with FITC-labeled mouse anti-rat RECA-1 mAb.
Abbreviation: PEI, polyethylenimine; EC, endothelial cell; KC, Kupffer cell.
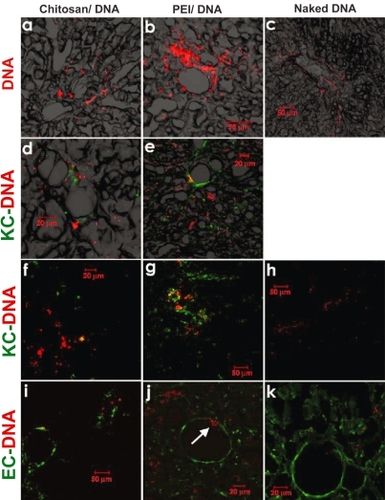
Figure 8 Serum ALT, AST, and ALP levels in rats that received nanoparticles and naked DNA through RII (n = 3).
Abbreviation: ALT, alanine transaminase; AST, aspartate transaminase; ALP, alkaline phosphatase; PEI, polyethylenimine.
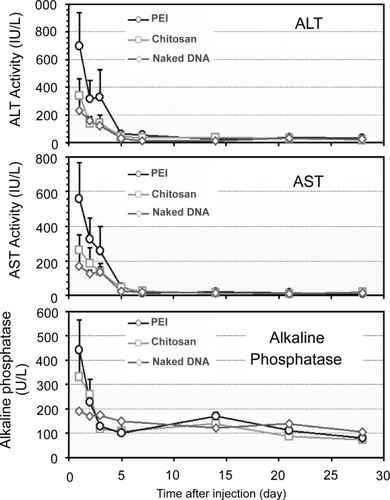
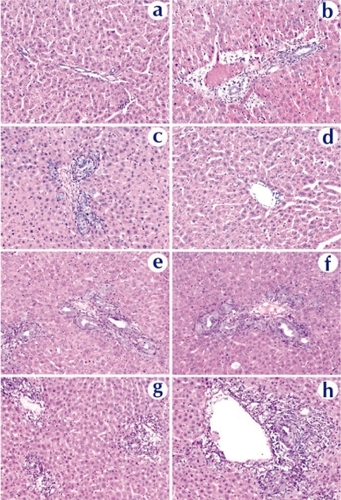
Figure 9 Histopathological examination of liver tissue extracted on day 3 from rats received naked DNA (c and d), chitosan-DNA nanoparticles (e and f), or PEI-DNA nanoparticles (g and h), in comparison with the naïve rat (a and b). Liver samples were collected on day 14, cryosectioned (8 μm thickness), and stained with H&E.
Abbreviation: PEI, polyethylenimine.