Figures & data
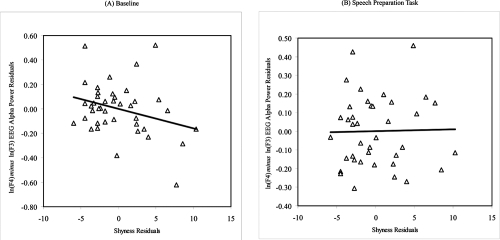
Figure 1 Residuals scatterplots of the relation between trait shyness (as measured by the Cheek and Buss Shyness Scale) and (A) baseline mid-frontal EEG alpha power asymmetry and (B) during the speech preparation task in a non-clinical sample of healthy young adults after controlling for concurrent depressive mood (Note: Negative EEG asymmetry scores reflect greater relative right frontal EEG activity.)