Figures & data
Figure 1 Subject flow diagram.
Abbreviations: ITT, intention to treat; PP, per protocol.
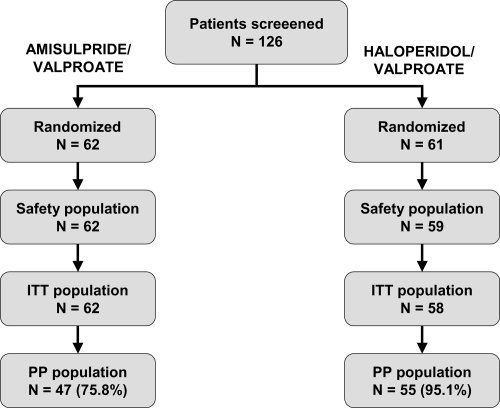
Table 1 Major protocol violations and premature study discontinuations in the ITT population. Note that individual subjects may present more than one protocol violation or reason for discontinuation and the categories are thus not mutually exclusive
Table 2 Baseline demographic and clinical characteristics of subjects in the intention to treat population. Data for categorical variables are presented as numbers of subjects (%) and quantitative variables as mean ± standard deviation
Figure 2 Treatment dose at study end. Left: amisulpride; right: haloperidol.
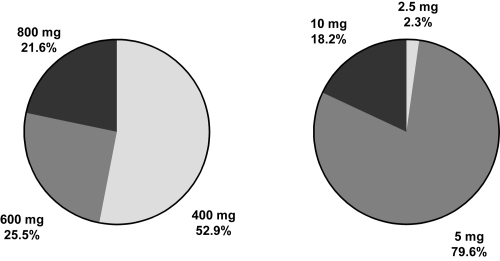
Figure 3 Young Mania Rating Scale scores over the course of the study in the intention to treat population. Data are presented as mean scores ± standard deviation. ○: amisulpride group; ■: haloperidol group.
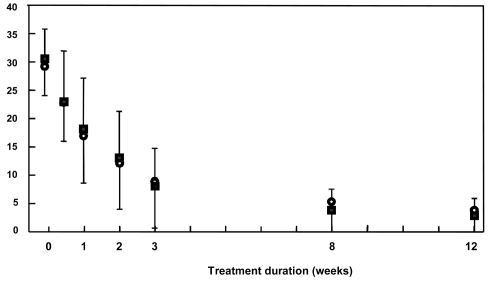
Table 3 Changes in rating scale scores over the study period in the ITT population. Data are presented as mean values ± standard deviation of change from baseline
Figure 4 Improvement over the course of the study in the intention to treat population. Patient satisfaction questionnaire. Grey bars: much improved; black bars: very much improved.
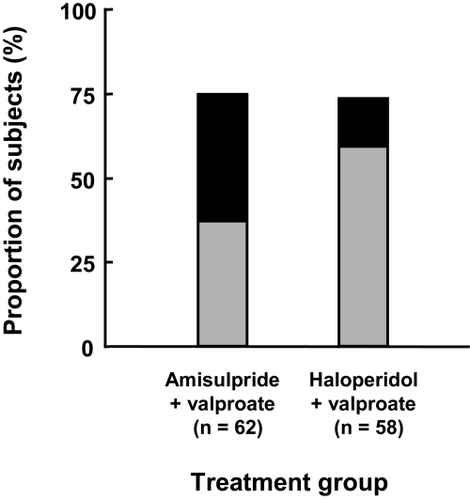
Table 4 Treatment-emergent adverse events reported in the Safety populationTable Footnotea
Table 5 Measures of extrapyramidal function in the Safety populationTable Footnotea
Table 6 Potentially clinically significant abnormalities in biochemical parameters in the Safety population