Figures & data
Table 1 Demographic data and cognitive performance differences between groups in the study
Table 2 Comparison of the cholesterol parameters (mg/dL) of AD subjects and neurologically normal controls
Figure 1 Ferric reducing ability of plasma (eq. Fe(II) μM) of patients with Alzheimer’s disease at different stages of the disease, as evaluated by GDS. Other details in Methods. The number of subjects in every group (n) was: n = 23 in the mild AD (GDS = 3–4);n = 24 in the moderate AD (GDS 5), and n = 12 for severe AD; n = 29 for the control group.
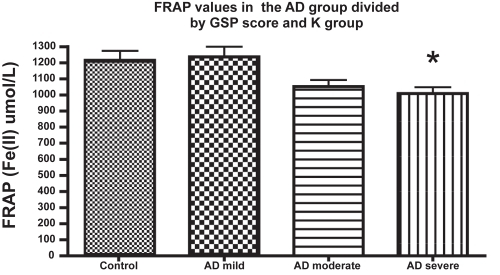
Table 3 FRAP, MDA levels, and TAC-crocin mean values and SD in both AD and control groups
Figure 2 (A) Correlation between FRAP (eq Fe(II) μM) and cognitive impairment in AD patients (r = 0.443, P < 0.01). (B) Correlation between FRAP (eq Fe(II) μM) and PRAXIAS test (r = 0.301, P < 0.05).
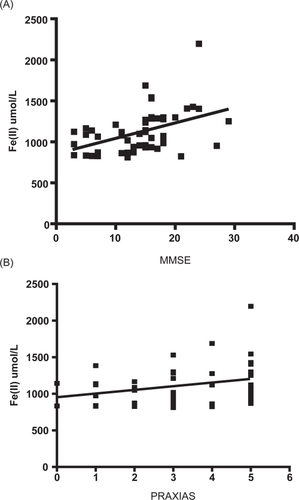
Figure 3 (A) Correlation between total cholesterol (mg/dL) and GDS in AD patients (r = −0.298, P < 0.05). (B) Correlation between VLDL (mg/dL) and GDS in AD patients (r = −0.382, P < 0.01).
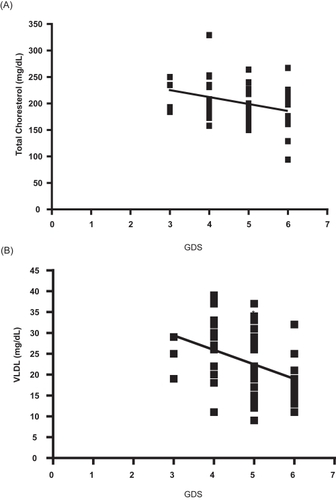
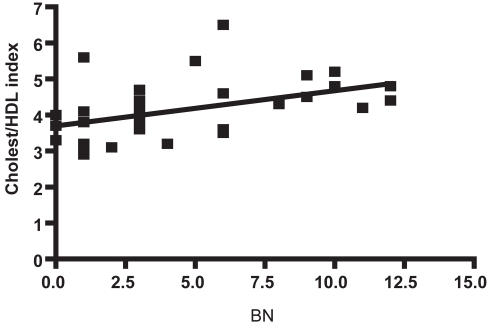
Figure 4 Correlations between Cholesterol/HDL index and Boston Naming Test (BNT) values in AD patients (r = 0.464, P < 0.01). Other experimental details in Methods section.